


Welcome to our July 2026 Cost of Living Report, where we share our family’s real household budget, grocery spending, savings, and financial progress as an Ontario family.
If you missed last month’s report, you can read our June 2026 Cost of Living Report first to see how our numbers changed from month to month.
We’re a little behind on our monthly budget updates this summer, but the budget itself has still been tracked. Rather than rushing through the numbers, I’d prefer to share an accurate report and explain what changed in our household.
Every month is different. Some expenses are predictable, while others move around depending on family life, seasonal costs, and the timing of projected expenses. That’s exactly why we continue to track everything rather than judge our finances by a single bill or shopping trip.
📊 July 2026 Budget Snapshot
For July, we planned to spend $8,564.00 and finished the month with actual expenses of $8,244.62. That put us $319.38 under budget.
Although our expenses were higher than in June, we still finished July below our planned spending. That’s a good reminder that a higher-spending month isn’t automatically a bad budget month.
What matters is whether the spending was planned, affordable, and aligned with our goals.
July at a Glance
July’s Biggest Win
July’s biggest budget win was groceries. We spent $776.29 of our $1,250 grocery budget, coming in $473.71 under budget. With food prices continuing to take a big bite out of household budgets, keeping our grocery spending this low was a welcome result.
| Budget Highlight | July 2026 |
| 💵 Total Budgeted | $8,564.00 |
| 💳 Actual Spending | $8,244.62 |
| ✅ Under Budget | $319.38 |
| 🛒 Grocery Budget | $1,250.00 |
| 🥦 Grocery Spending | $776.29 |
| 📱 Flashfood Net Spent | $202.43 |
| 💰 Flashfood-Reported Savings | $555.42 |
Budgeted vs. Actual Spending
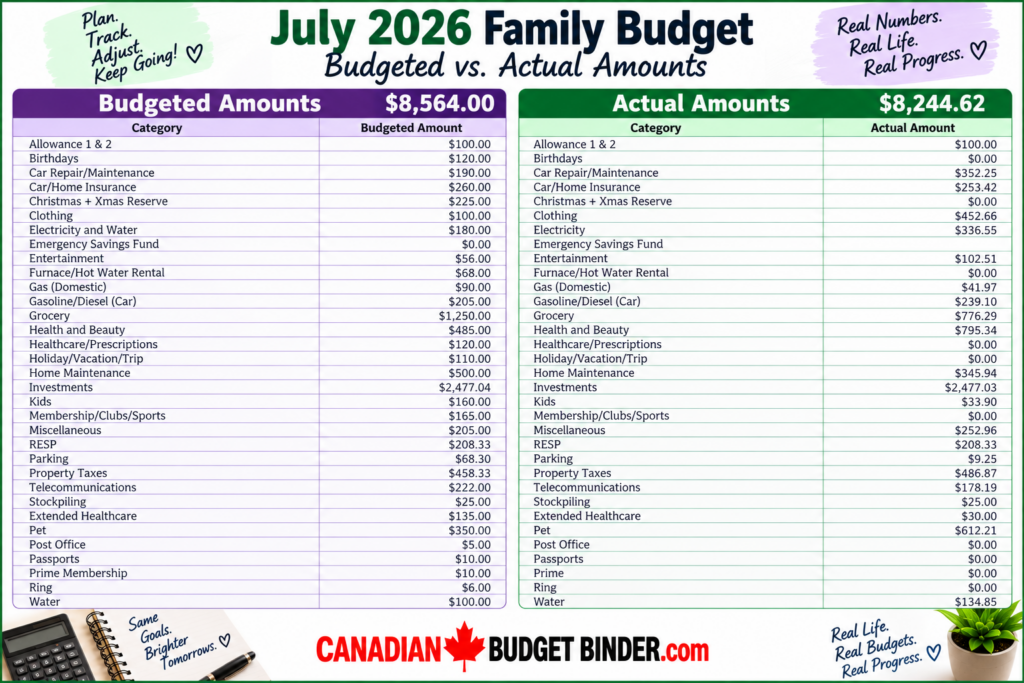
July’s biggest over-budget categories included clothing ($452.66 actual vs. $100 budgeted), health and beauty ($795.34 actual vs. $485 budgeted), pet expenses ($612.21 actual vs. $350 budgeted), and car repair and maintenance ($352.25 actual vs. $190 budgeted).
Those increases were offset by lower spending in other areas. Groceries were the standout: we spent $776.29 against a $1,250 budget, leaving $473.71 in that category. Home maintenance was also below plan at $345.94, compared with the budgeted $500.
Our July budget was $8,564.00, and our actual expenses were $8,244.62, leaving $319.38 unspent compared with our plan.
We don’t expect every budget category to land exactly on its target. Some categories will come in higher, and others lower. The goal is to understand where the money went and whether the overall plan is still working.
This is also why projected expenses remain such an important part of our budgeting system. Annual bills, vehicle costs, home repairs, school expenses, and other predictable costs are easier to manage when we prepare for them over time rather than treating them as emergencies.
Monthly Spending Trends (2026)
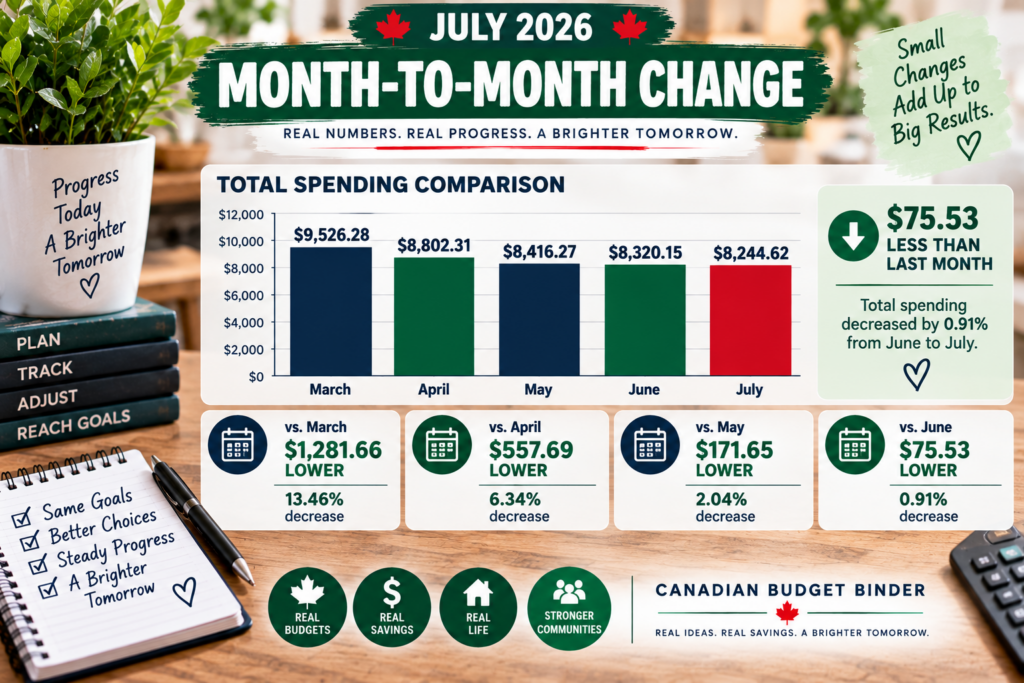
Looking at our budget over several months gives us a broader perspective than reviewing a single month’s results. Tracking trends helps us recognize seasonal spending patterns, celebrate improvements, and identify areas where we may need to adjust our budget in the months ahead.
Year-to-Date Spending Breakdown (2026)
Looking at our year-to-date spending percentages helps us understand how our household budget has been allocated over the year, rather than focusing on a single month.
By tracking these trends, we can see which categories consistently require the largest share of our budget, identify changes in our spending habits, and make informed adjustments as our financial goals evolve.
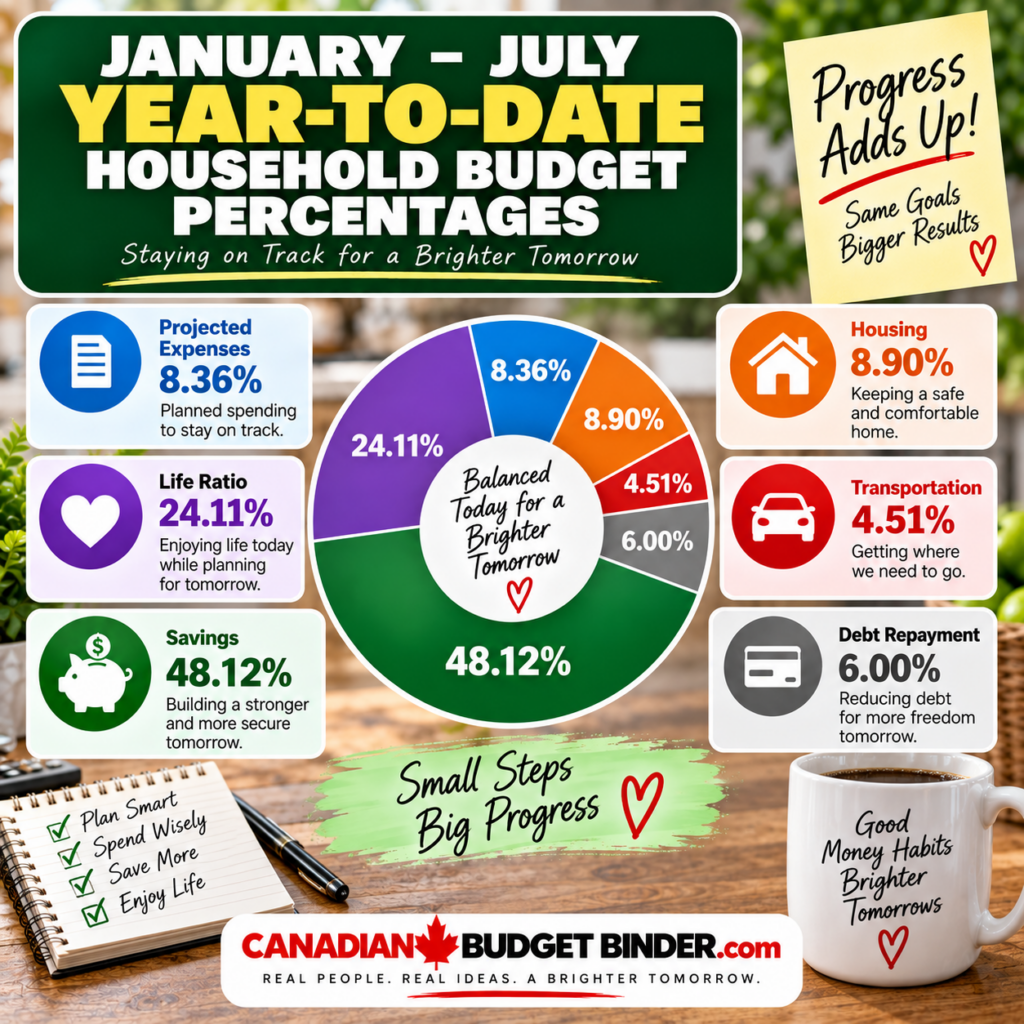
From January through July 2026, our year-to-date household budget percentages were: Projected Expenses 8.36%, Life Ratio 24.11%, Savings 48.12%, Housing 8.90%, Transportation 4.51%, and Debt Repayment 6.00%.
Tracking these percentages year-to-date gives us a broader view of where our money has been going throughout 2026, rather than focusing on a single month’s results.
July Compared With June
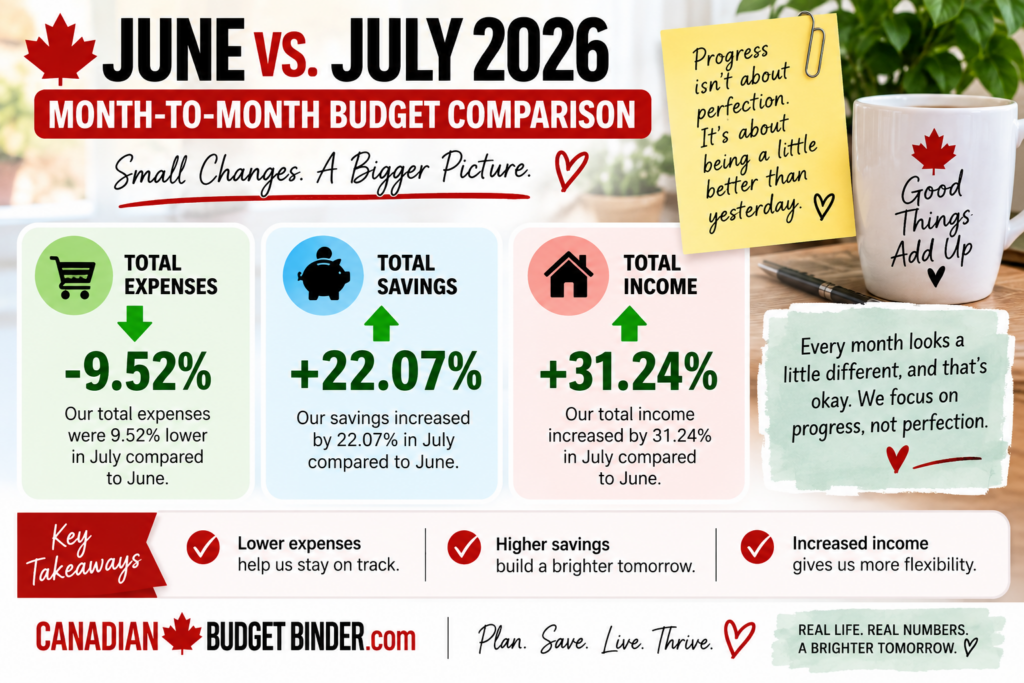
June’s actual spending was $7,060.19. In July, our actual expenses increased to $8,244.62, a difference of $1,184.43 or approximately 16.78%.
At the same time, our household income increased by 31.24% from June to July, and the amount going into emergency savings increased by 97.40%. We don’t publish the dollar amounts for those two figures, but tracking the percentages still helps us see the direction our finances are moving.
Spending was higher, but our income and emergency savings also improved. Looking at the full picture gives us much more useful information than focusing on a single number.
Household Budget Percentages
Reviewing our spending by percentage helps us see where our money actually went during the month. Rather than focusing solely on dollar amounts, these percentages make it easier to identify our largest expenses and areas where we may be able to improve in the coming months.
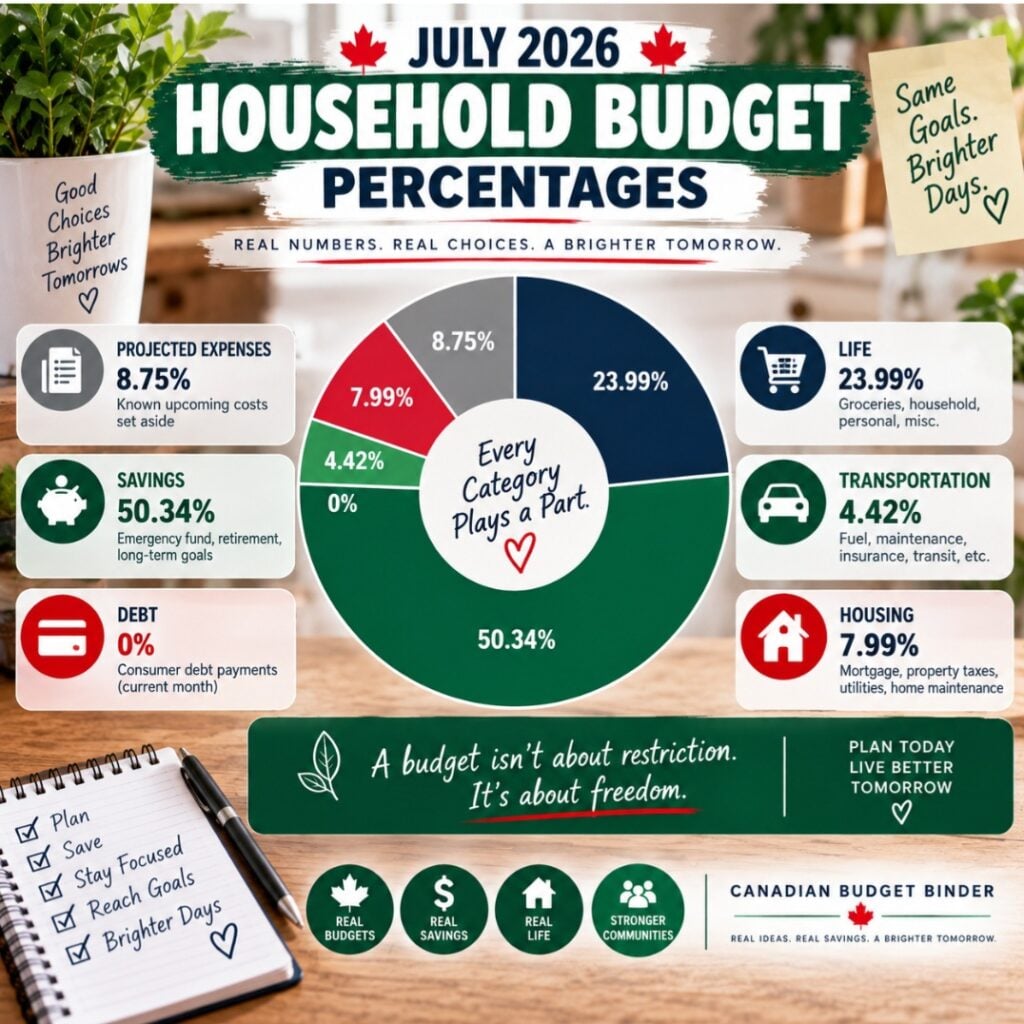
Our July household budget ratios were: Projected Expenses 8.75%, Life Ratio 23.99%, Debt Repayment 0.00%, Transportation 4.42%, Savings 50.34%, and Housing 7.99%. We use these percentages as another way to watch the balance of our household spending and saving without relying only on dollar totals.
🛒 July 2026 Grocery Spending & Savings
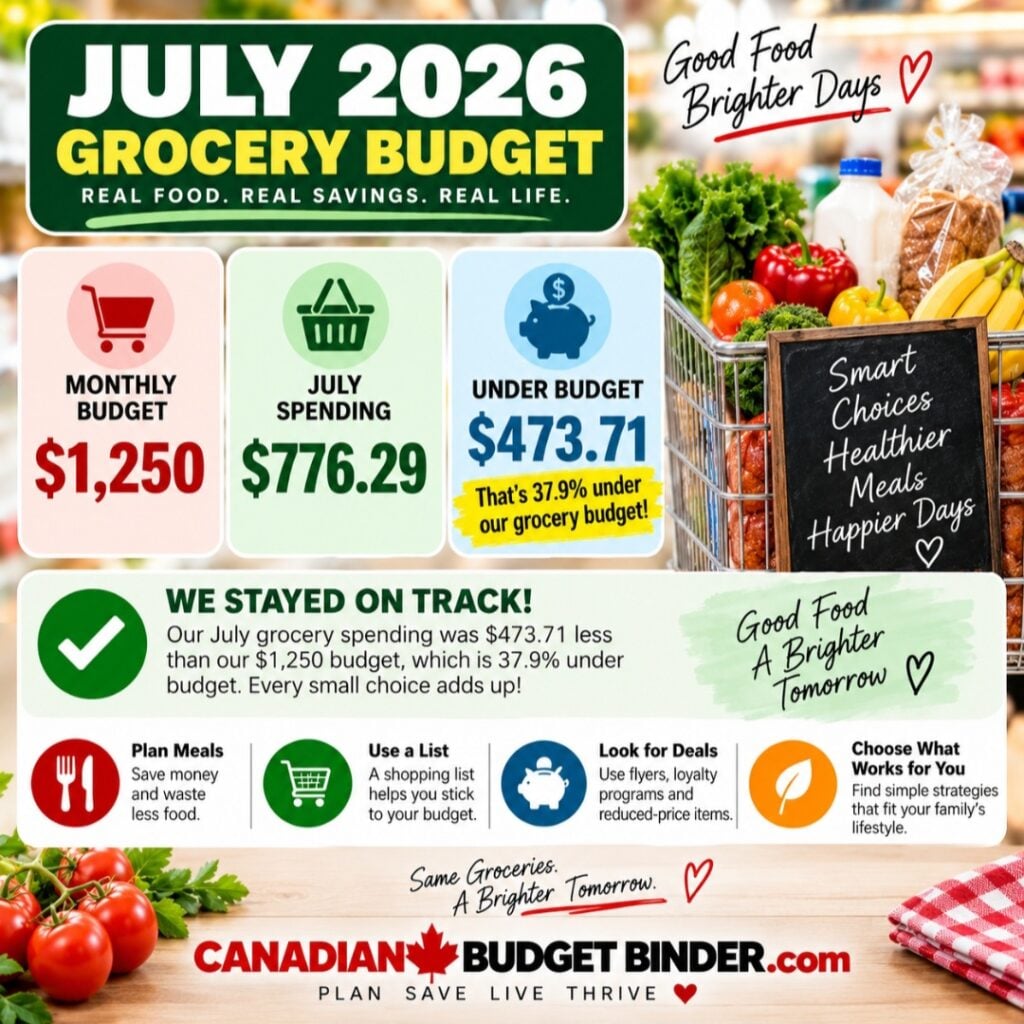
Our monthly grocery budget for 2026 is $1,250. Grocery prices remain among the household expenses we watch most closely because food is both essential and a category where shopping habits can make a noticeable difference.
We spent $776.29 on groceries in July, which was $473.71 under our $1,250 monthly grocery budget.
Throughout July, we continued relying on the same habits that have helped us control grocery costs over the years: meal planning, checking weekly sales and markdowns, shopping our pantry and freezer first, using rewards programs, comparing prices, and buying Flashfood items when they genuinely make sense for our household.
If you’re trying to get a better handle on grocery prices, our Grocery Price Book guide and unit pricing guide are two useful places to start.
2026 Grocery Spending Tracker
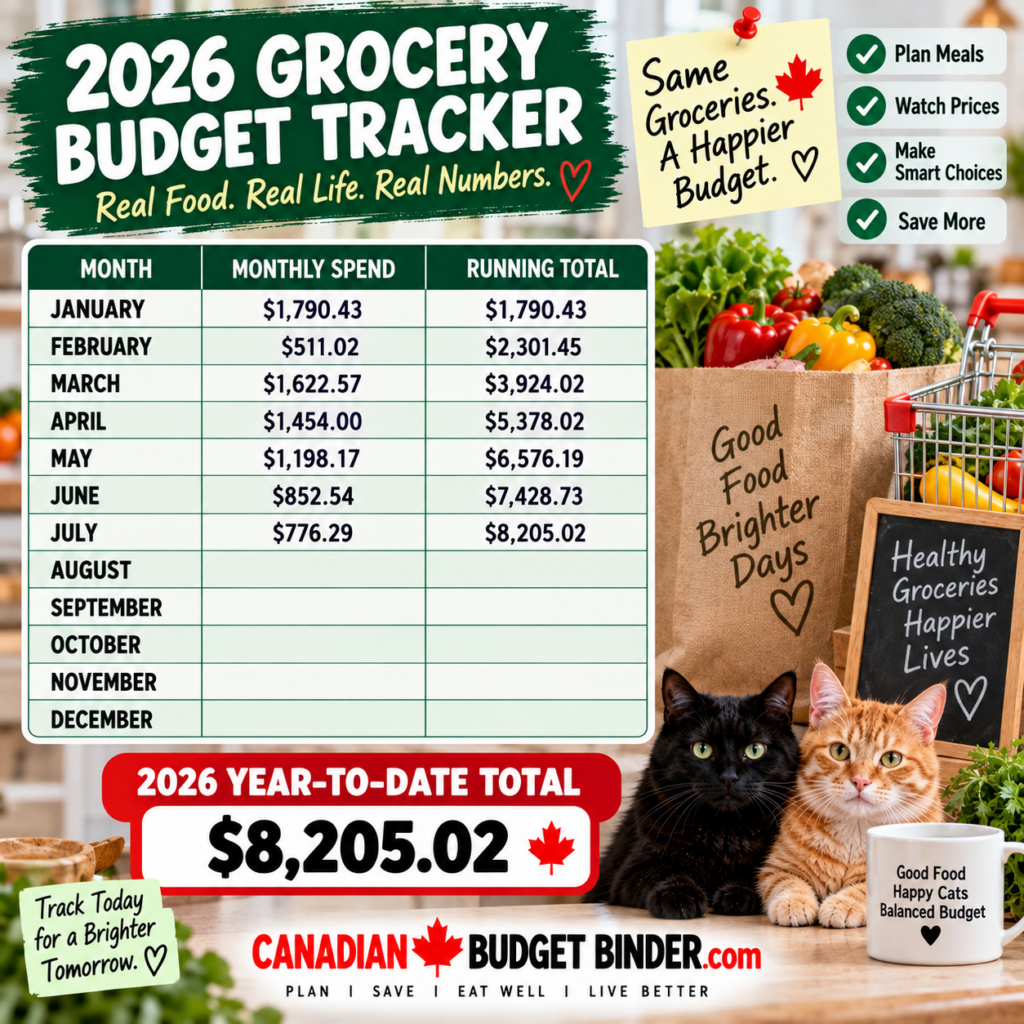
Through the end of July, we have spent $8,205.02 on groceries in 2026. Tracking the running total helps us see how our monthly spending adds up over the year.
If I had to estimate where we’ll finish the year, I’d say somewhere around $15,500, depending on how the remaining months go. With a monthly grocery budget of $1,250, our annual target is $15,000, so that would put us roughly $500 over budget for 2026.
That’s not something I see as a failure. Instead, it gives us a real number to evaluate when we sit down to set our grocery budget for 2027. Our grocery budget needs to reflect what food actually costs our family, while still providing a target that encourages us to shop carefully.
Grocery Savings Jar
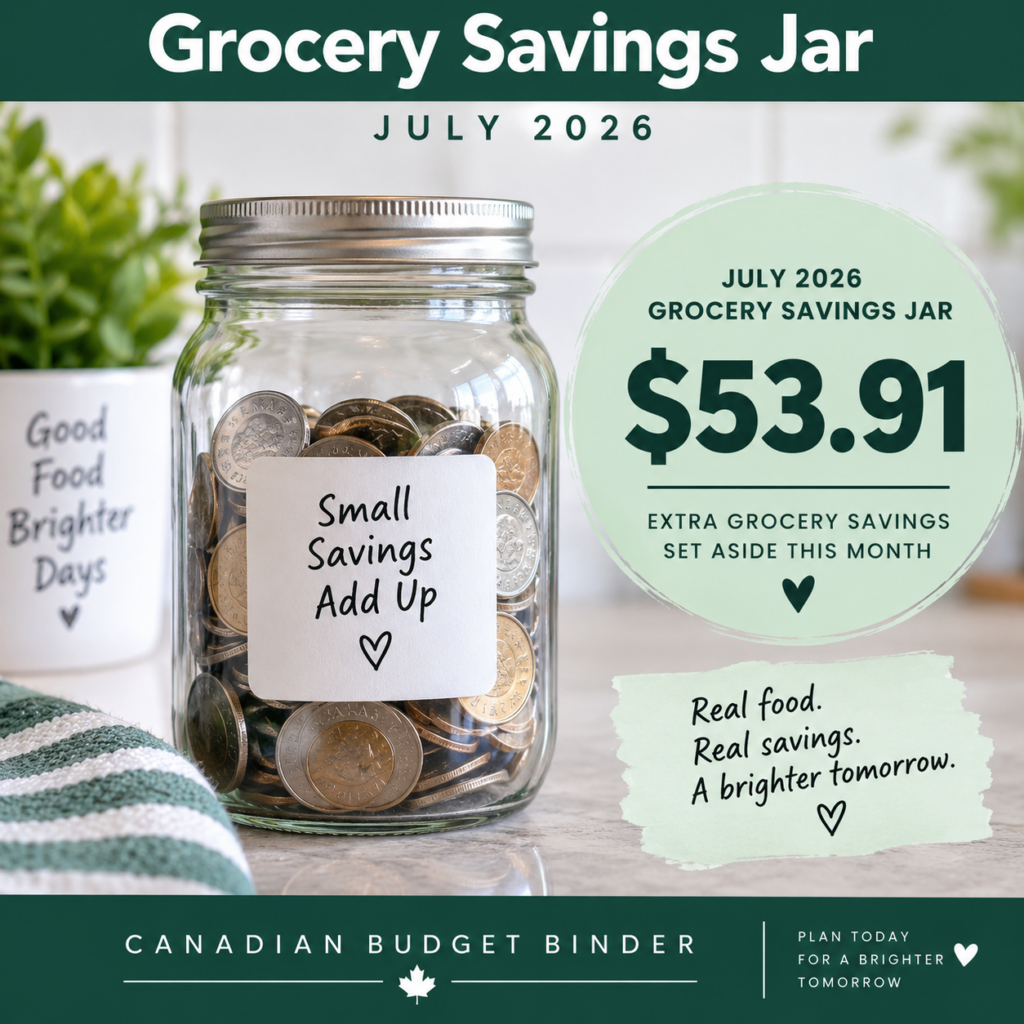
Our July Grocery Savings Jar total was $53.91. This tracker is reserved for special markdown savings such as 50%-off stickers, manager specials, and reduced-to-clear items. We do not count ordinary sale prices here.
We also keep this number separate from Flashfood savings, so we don’t double-count different types of grocery savings.
Running Total Grocery Savings Jar 2026
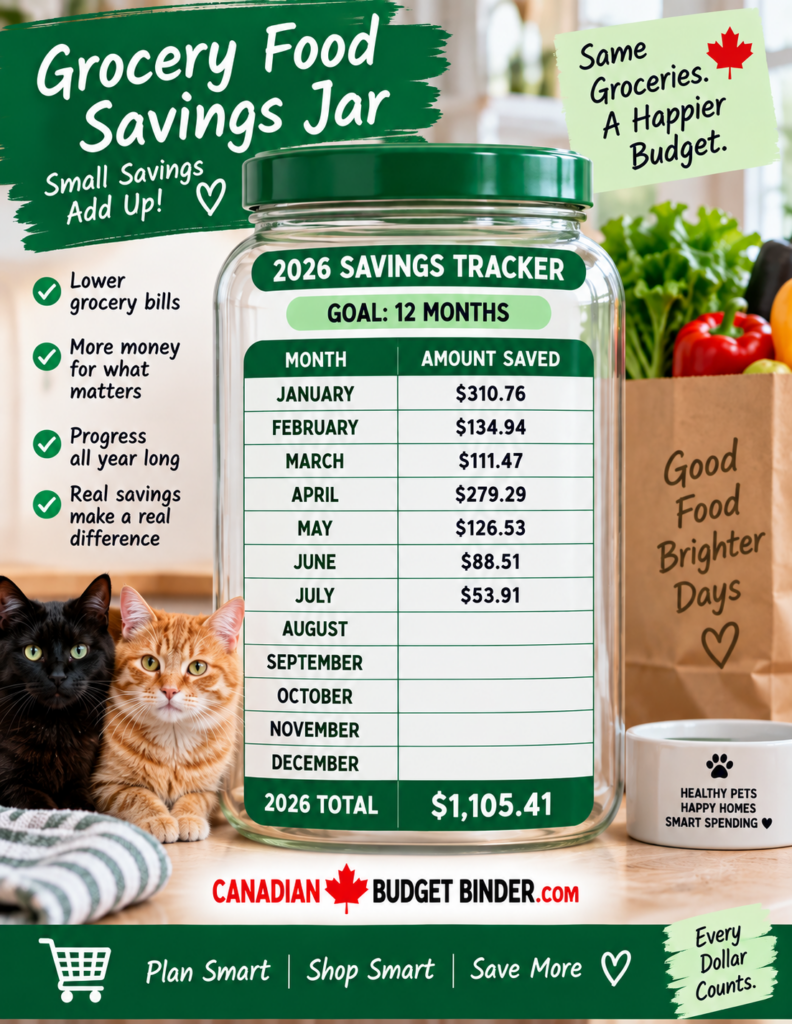
From January through July 2026, our Grocery Food Savings Jar has reached $1,105.41. These are tracked savings from qualifying markdowns and discounts, kept separate from our regular grocery spending and Flashfood savings.
July Flashfood Savings
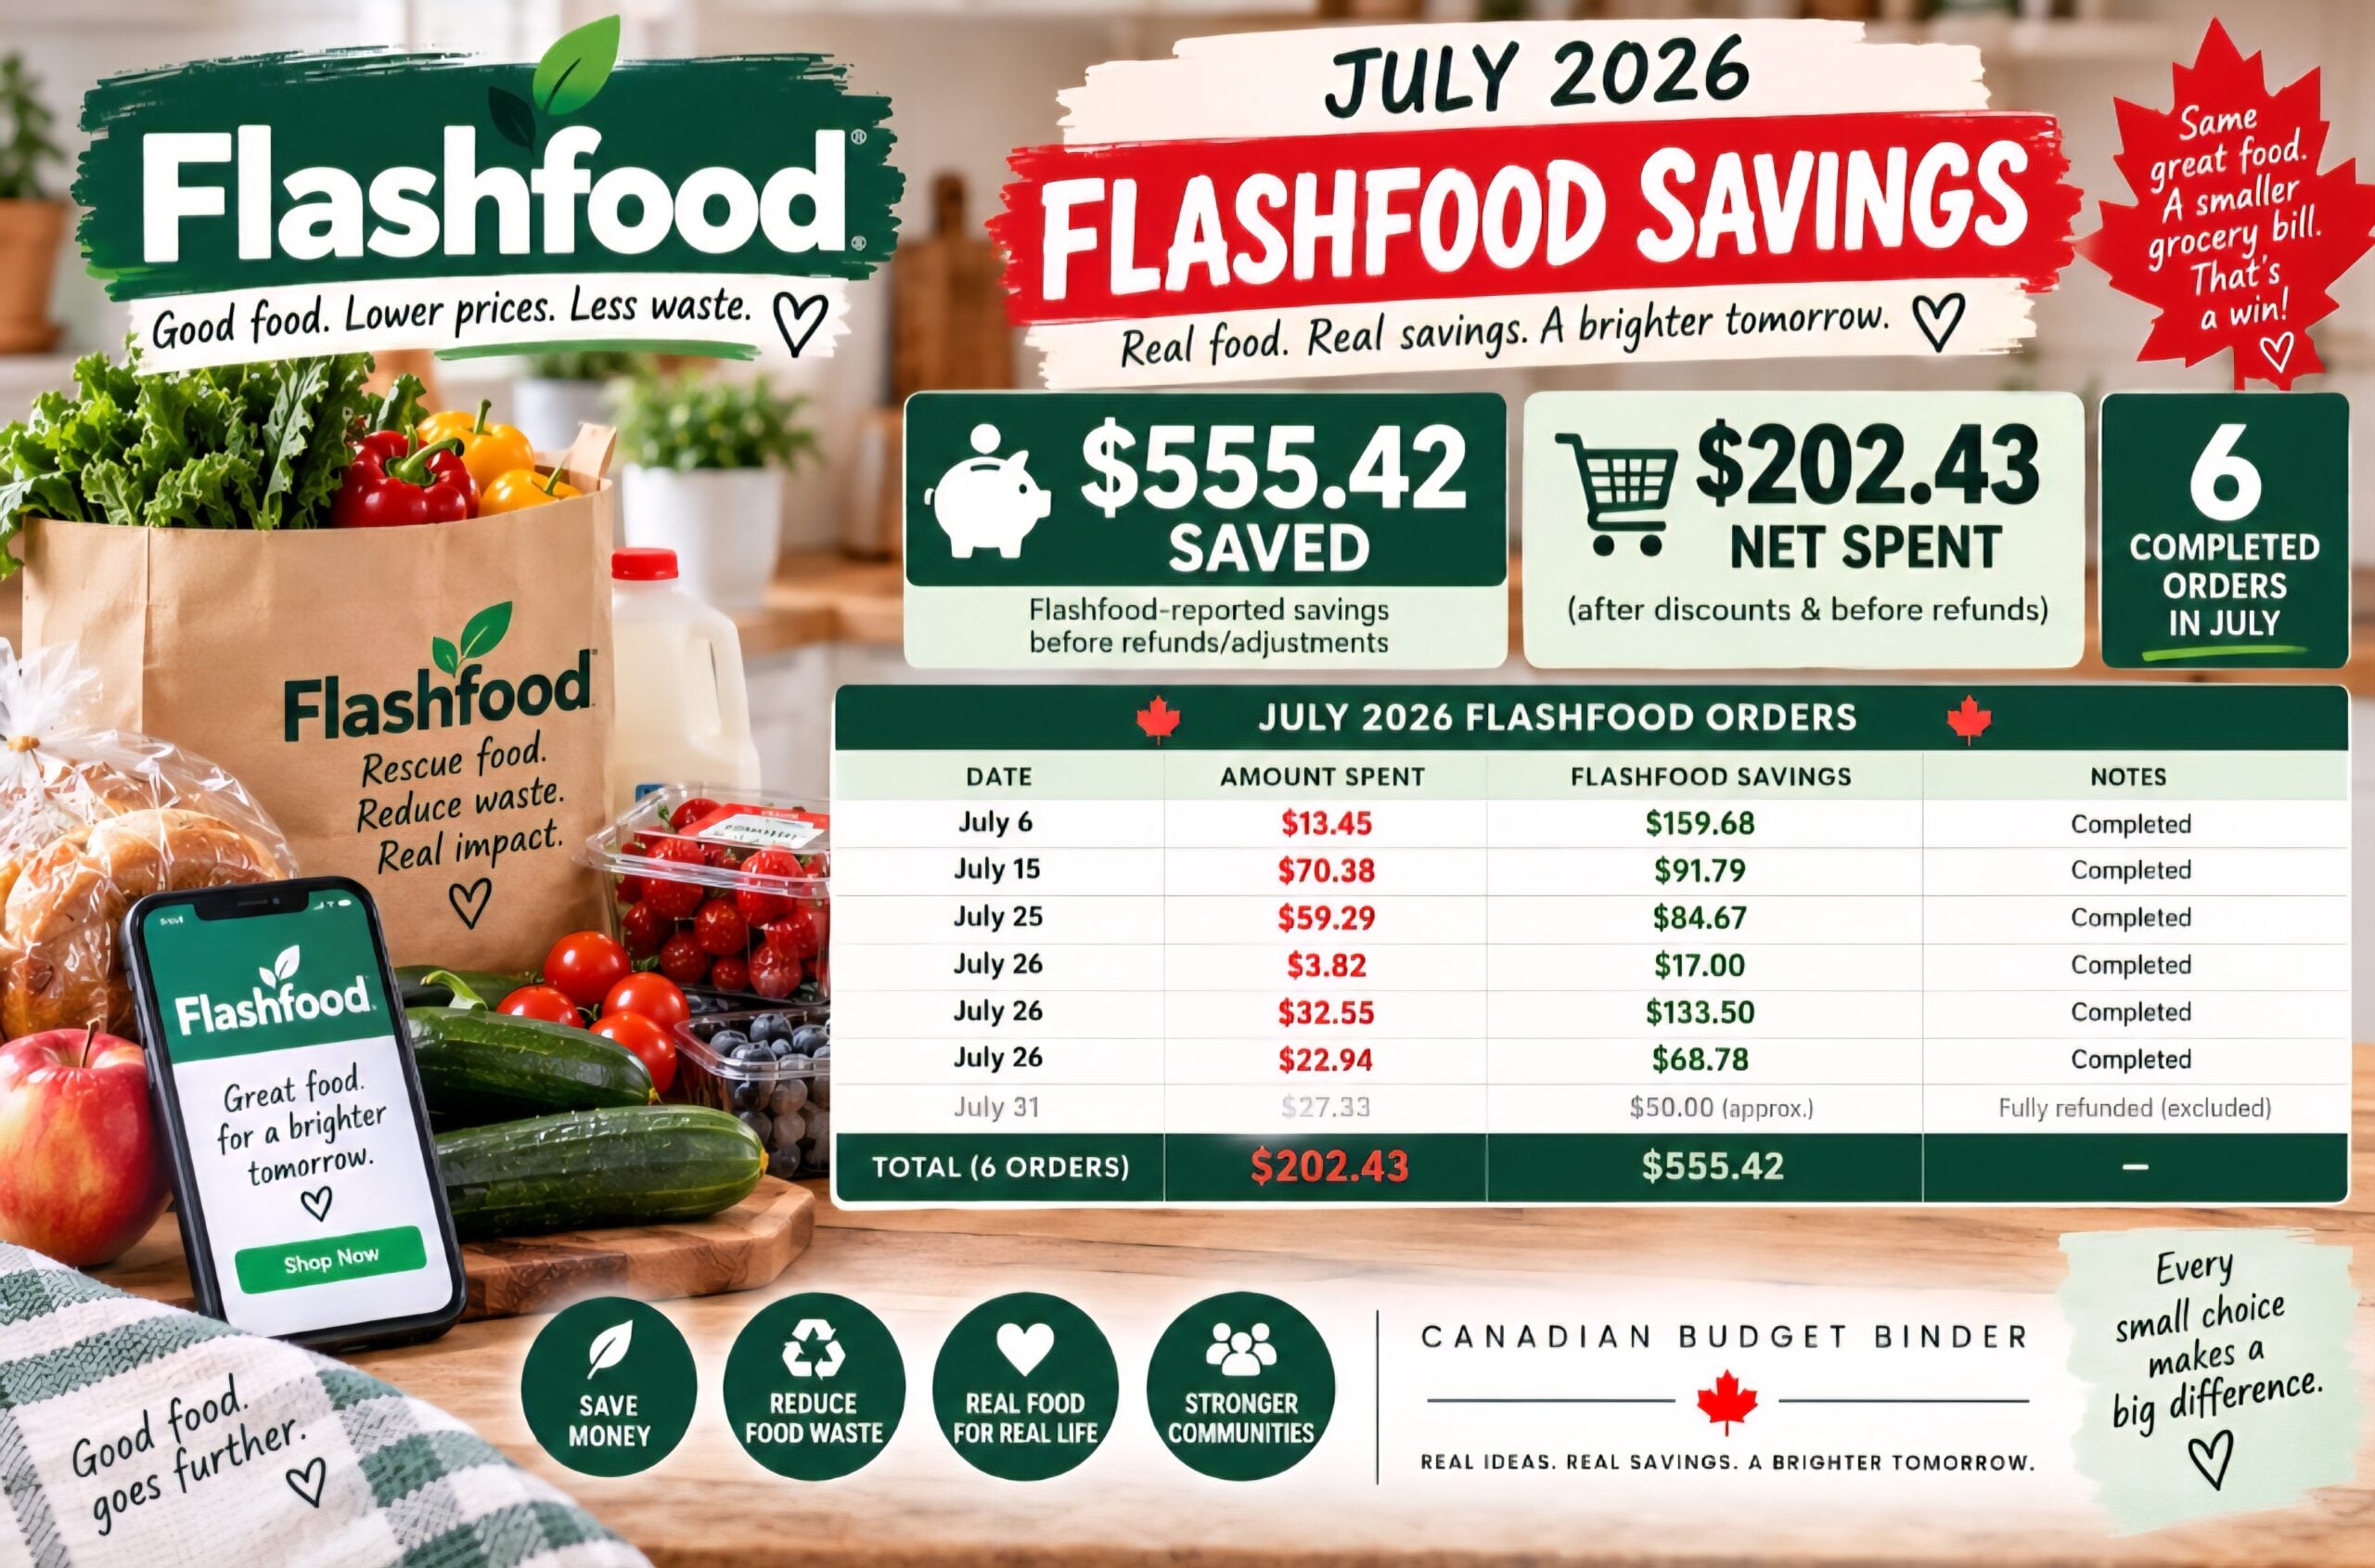
Flashfood was a particularly strong grocery-saving tool for us in July. We completed six orders, spent a net $202.43, and the app reported $555.42 in savings before refunds and adjustments.
We also had a July 31 order for $27.33 that was fully refunded, so I excluded that order from both the completed-order spending and savings totals above.
That doesn’t mean every Flashfood listing is automatically a good deal. I still compare the price, ask whether we’ll actually use the food, and make sure we have room to freeze or store what we buy. A discount only saves money if the purchase makes sense.
You can read our full Flashfood guide for more about how we use the app.
A Quick Family Update: The Cats

Both of our cats had their regular veterinary checkups and rabies shots in July. Pet care isn’t always cheap, and July’s pet expenses were higher than planned, but routine care is one of those household costs we make room for in the budget.
Their routine checkups, which also included their yearly flea medication, cost us a little over $400. As we get into August, though, we have one more costly trip to the vet ahead of us. I think our cats secretly enjoy going because they know there are treats involved. Ha!
On a happy note, our neighbour recently adopted an older white male cat who had undergone about $8,000 worth of surgery. Since we had extra cat toys, hideaway huts, and tins of wet cat food, we donated some of them to help him settle into his new home.
We still have more to pass along, but for now, it’s just nice knowing that another cat has found a family where he’s loved and cared for.
Rewards and Grocery Savings
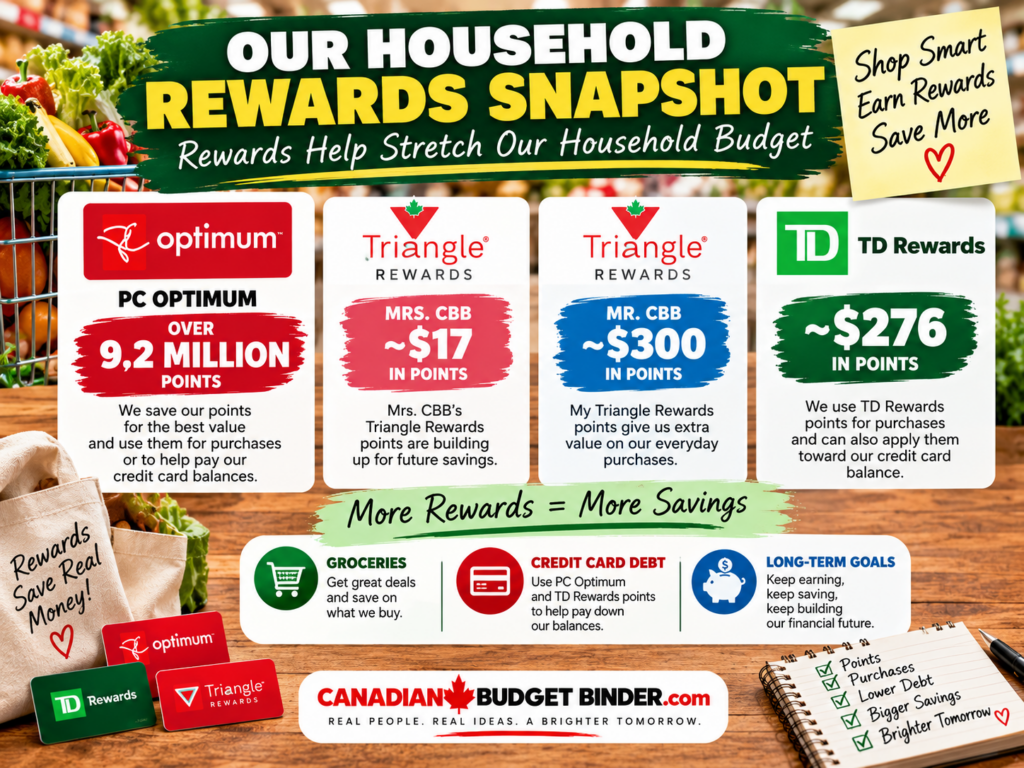
Rewards are another part of our household savings strategy. We currently have more than 9.2 million PC Optimum points, approximately $300 in my Triangle Rewards account, and $17 in Mrs. CBB’s, along with about $276 in TD Rewards.
We don’t rush to redeem rewards just because they’re available. We like to build them up and use them where they can have the most impact on our household budget. Both our PC Optimum and TD Rewards can also be applied to our respective credit card balances, giving us another option to reduce what we owe rather than using cash from our budget.
For us, rewards aren’t an excuse to spend more. They’re simply something we collect on purchases we were already planning to make, and over time, those points and rewards can add up to meaningful savings.
I recently updated our guide on protecting PC Optimum points from scammers. If you save a large points balance, protecting the account should be part of your regular financial routine, too.
Net Worth and Long-Term Progress
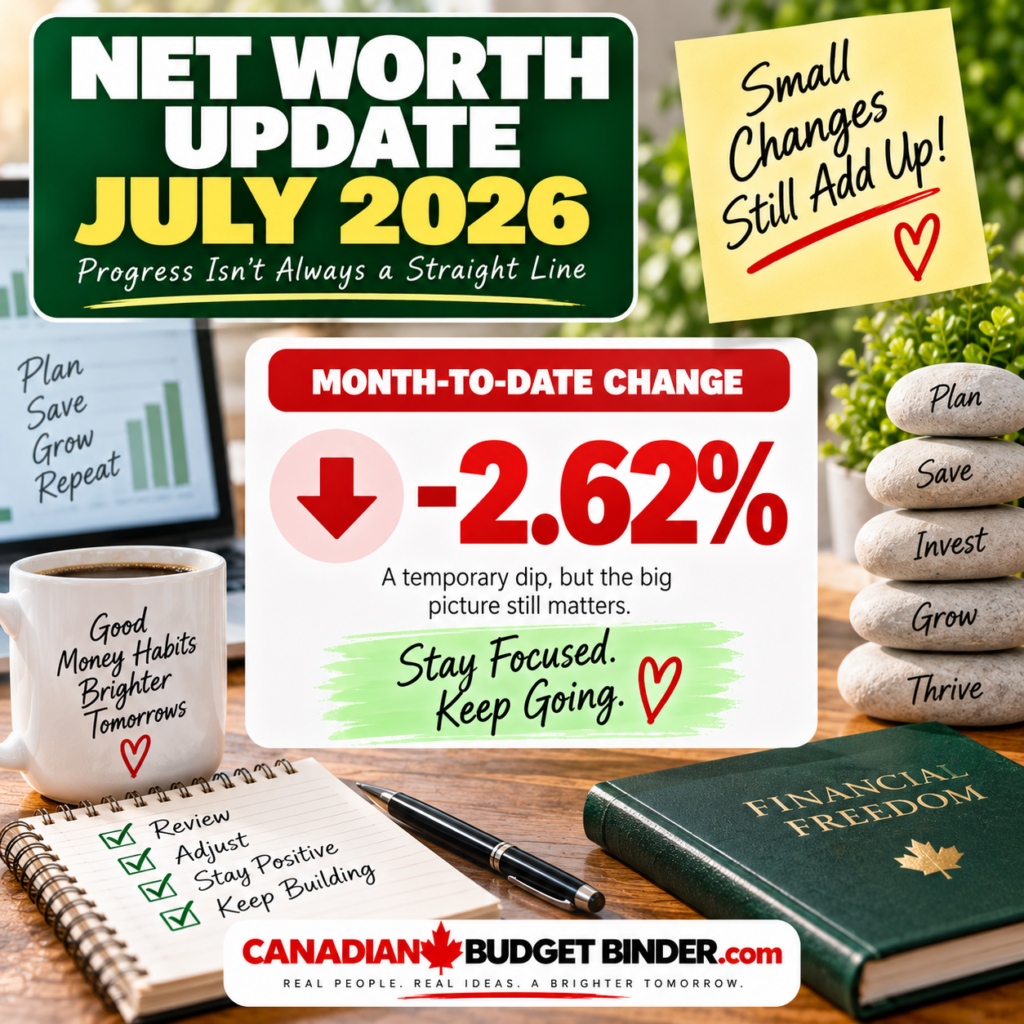
We continue tracking our net worth every month, although we choose not to publish the exact dollar amount. What matters most to us is the direction of the trend and whether our regular saving and investing habits continue moving us forward.
Our net worth decreased by 2.62% from June to July. Month-to-month changes are normal, which is why we focus on the longer-term direction rather than one month’s result. We track the percentage change without publishing our household’s net worth in dollar terms.
What July Taught Us
July was a good example of why we don’t measure budget success by how little we spend. Our expenses increased compared with June, yet we still finished under our planned budget. At the same time, income and emergency savings moved higher.
A budget isn’t about perfection. It’s about having enough information to make better decisions, adapting when life changes, and continuing to make progress.
The biggest lesson for us this month was simple: look at the whole financial picture. Spending, saving, income, groceries, and long-term goals all work together.
Looking Ahead to August
As we move into August, we’ll keep tracking every dollar, monitor grocery costs, use Flashfood selectively, and set money aside for projected expenses. We’re also working to get our monthly budget reports caught up after a very busy summer.
The goal remains the same: make intentional choices with our money without letting the budget take over our lives.
Why We Share Our Real Budget
Canadian Budget Binder started as a way for our family to stay accountable and document our financial journey. More than a decade later, we still believe there’s value in showing what a real household budget looks like—including the months when expenses rise.
No two family budgets are alike. Your income, housing, family size, location, priorities, and financial goals may look completely different from ours. These reports aren’t meant to tell you what your budget should be. They’re simply an honest look at how we manage ours.
If one of our successes, mistakes, or money-saving ideas helps you make a better decision in your own household, then sharing the numbers has been worthwhile.
Community Question
How did your July budget turn out? Did summer spending push any categories higher than expected, or did you find a way to save more than you planned?
Share your biggest financial win, surprise, or lesson from the month in the comments. The conversations below these budget updates often give us all new ideas.
July 2026 Budget Final Thoughts
We finished July $319.38 under budget, despite spending more than in June. We also saw higher income and emergency savings, while Flashfood continued helping us reduce grocery costs.
That’s the kind of progress we want our budget to support: not perfection, but awareness, flexibility, and steady movement toward our long-term goals.
If you’d like to organize your own household finances, you can also download our free Canadian Budget Binder printables.