


We saved 22.89% of our planned grocery budget in August. So why did our Ontario family’s total household spending still finish 12.08% over budget? This month’s cost of living report explains how groceries stayed on track while recovery-related purchases, pet care, home maintenance and back-to-school costs pushed other categories higher. We share percentages and practical lessons rather than private income, balances or household spending amounts.
Catch up with our July 2026 cost of living report before reading August’s results.
August 2026 Budget Snapshot
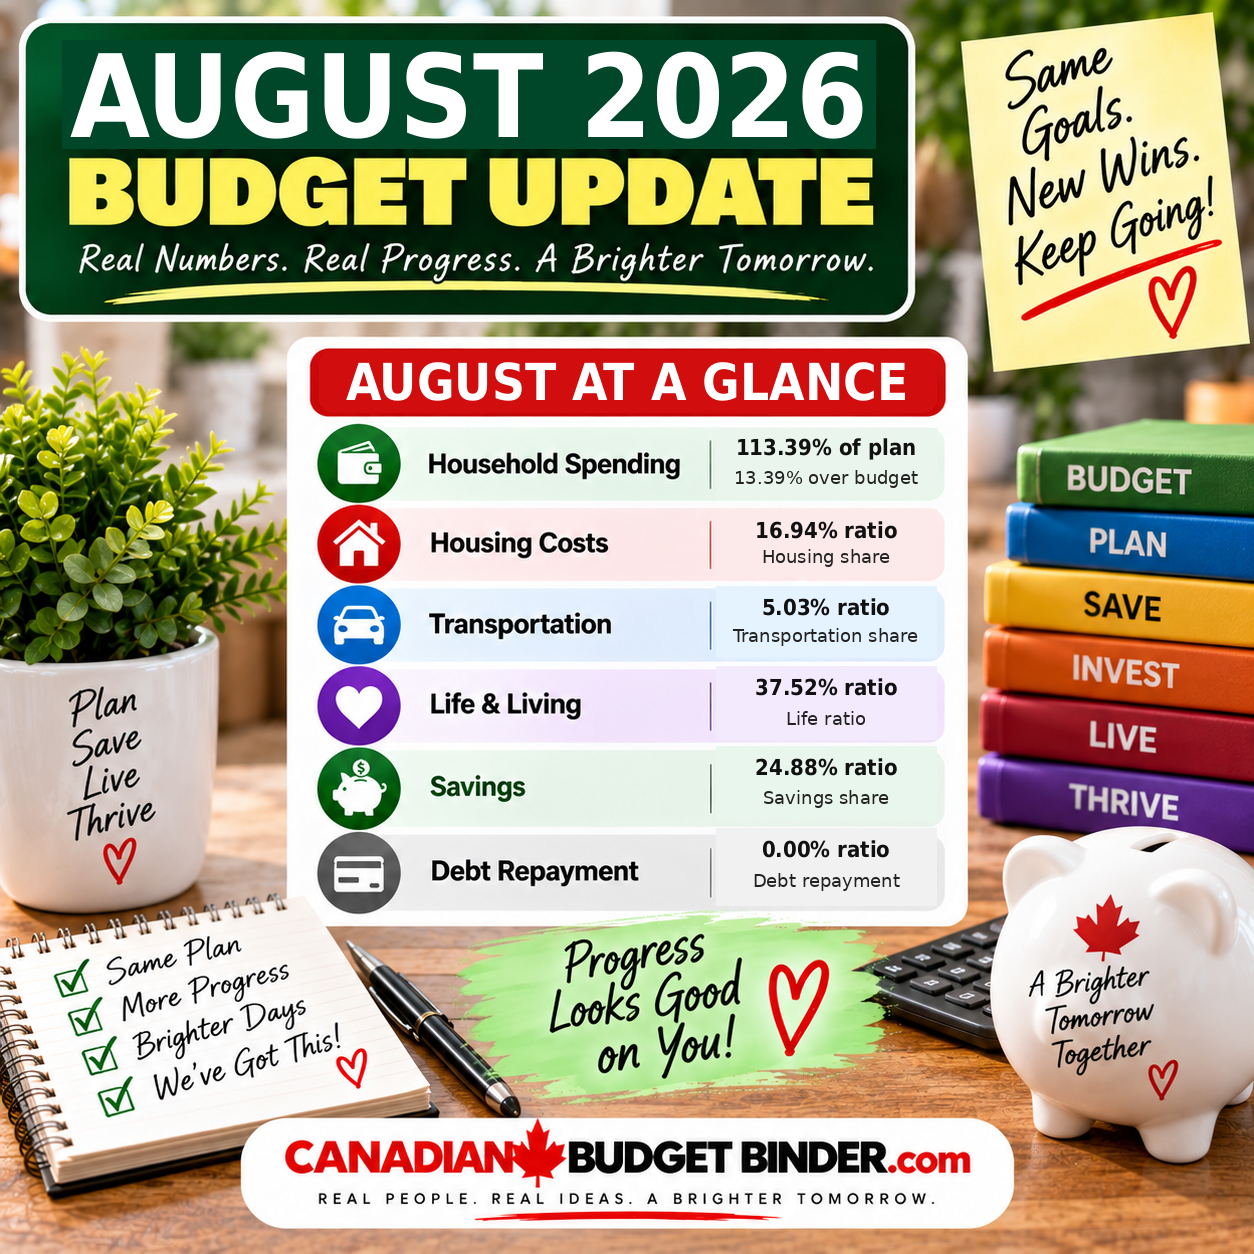
- Actual household expenses rose approximately 17.78% compared with July.
- Actual spending was approximately 12.08% above our planned August budget.
- Our savings ratio was 24.88%.
- Our overall net worth increased 1.22% month over month; we do not share the dollar value.
- Our household recorded a 0% debt repayment ratio in August.
Higher spending does not automatically mean our budget has failed. Our balanced budget guide shows how we compare planned expenses with what actually happens each month. The point of tracking each category is to see which costs changed and decide what needs attention next month.
Budgeted vs. Actual Spending
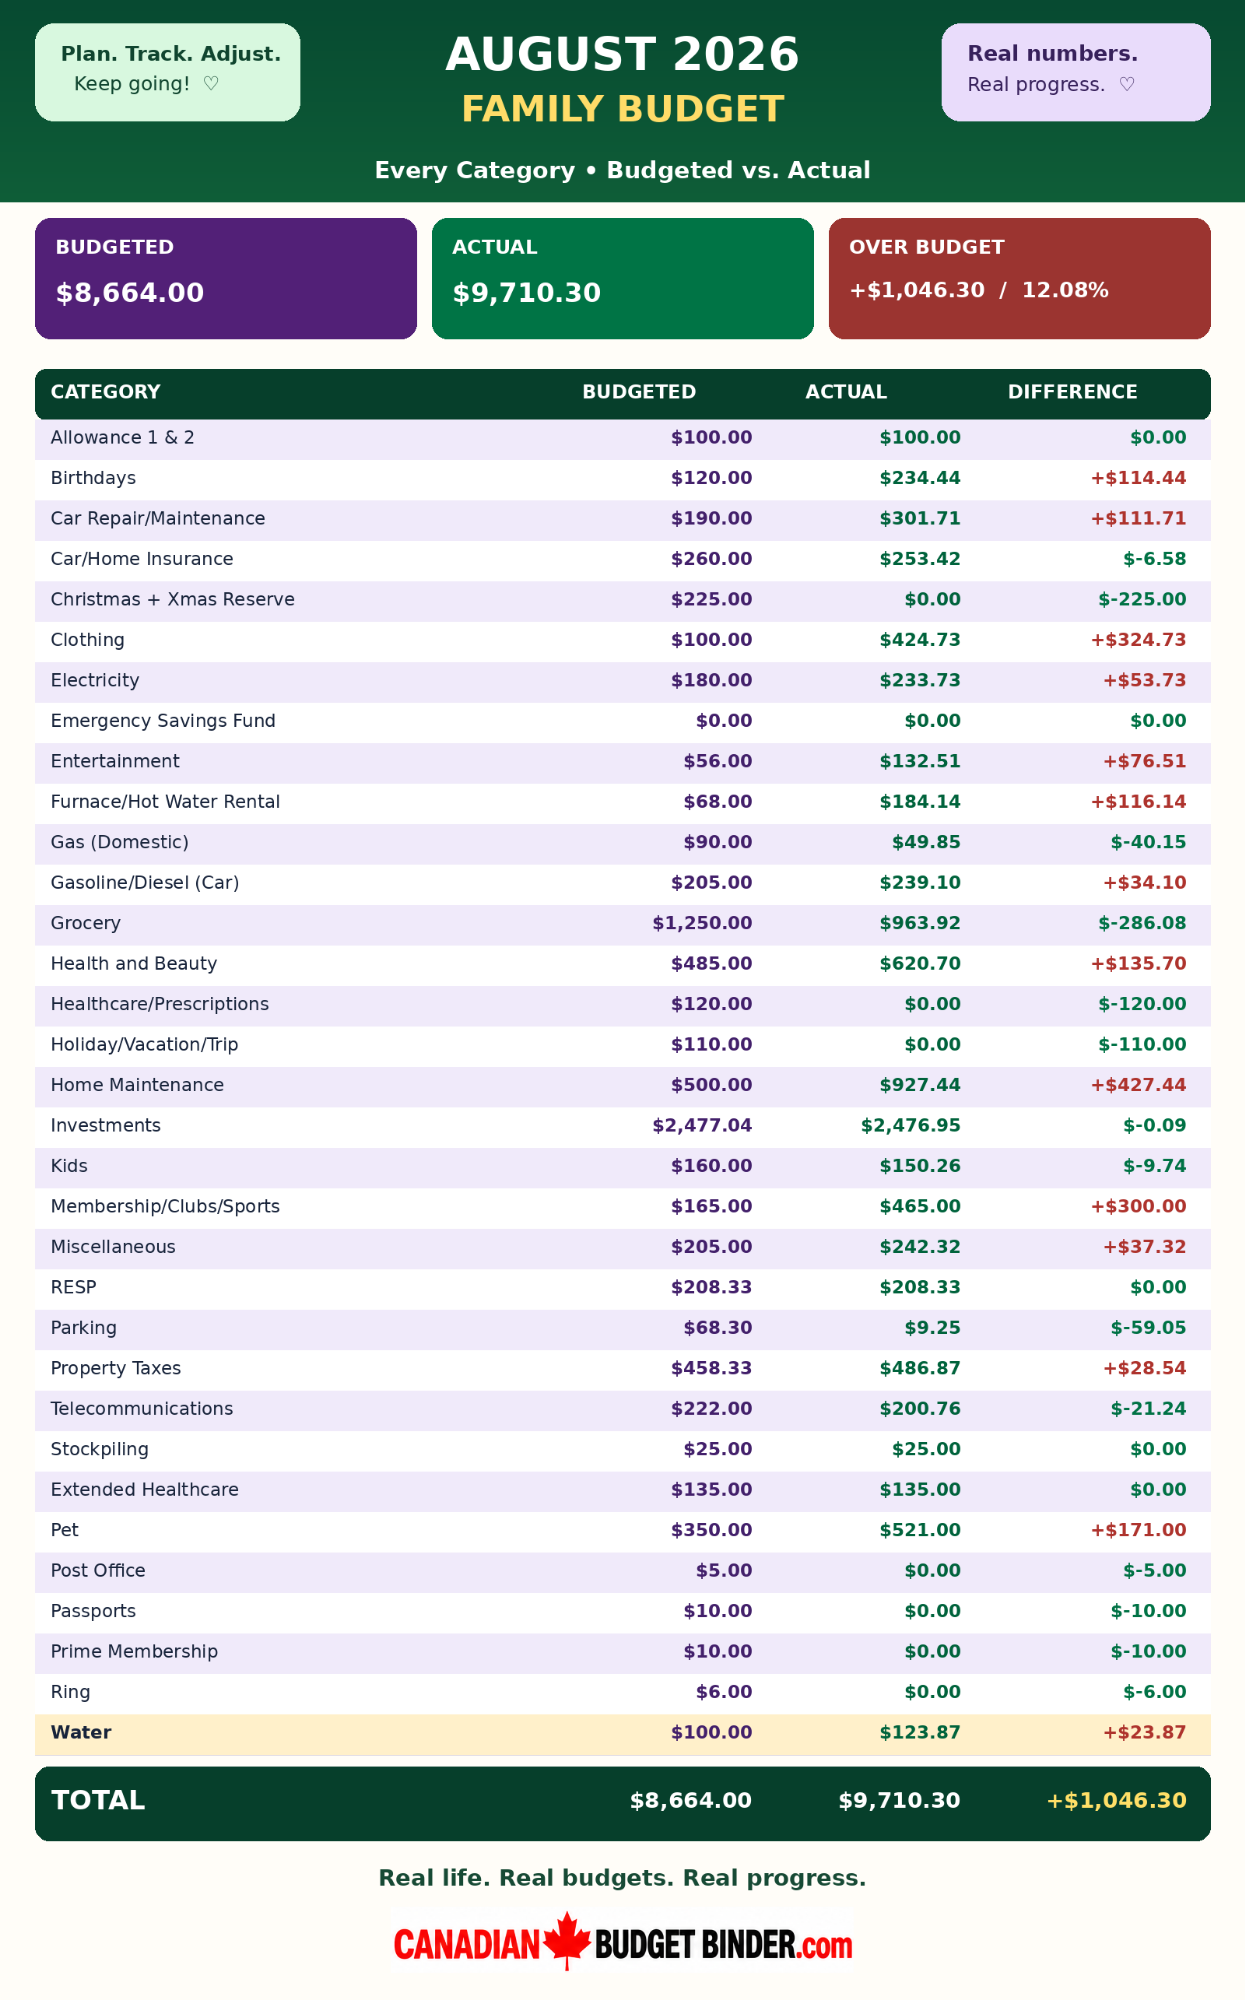
August’s surprise: We used just 77.11% of our grocery allowance, yet total household expenses reached 112.08% of our overall plan. Saving on groceries helped, but it couldn’t fully offset several larger family, pet and home costs.
| August budget comparison | Actual as % of plan | Result |
|---|---|---|
| Entire household budget | 112.08% | 12.08% over |
| Groceries | 77.11% | 22.89% under |
| Home maintenance | 185.49% | 85.49% over |
| Pet expenses | 148.86% | 48.86% over |
| Health and beauty | 127.98% | 27.98% over |
| Birthdays | 195.37% | 95.37% over |
| Sports, clubs and memberships | 281.82% | 181.82% over |
| Car repairs and maintenance | 158.79% | 58.79% over |
Each percentage compares spending with that category’s own budget. These are not shares of total household expenses.
Several categories exceeded their individual plans, including home maintenance, pet expenses, health and beauty, birthdays, and sports or memberships. If you’re setting up your own spending plan, our guide to choosing budget categories explains how to organize expenses without overlooking irregular costs. Other categories were below budget, helping offset some of the extra spending.
Our biggest lesson this month is that an annual or irregular expense can throw off a monthly comparison even when it is an expense we expect to encounter eventually. We use projected expenses to prepare for those costs.
August Grocery Budget and Savings
August Flashfood Results
We completed nine Flashfood orders in August after excluding one fully refunded order. The app’s reported savings are estimates based on listed comparison prices, not cash deposited into our account.
Our discounted finds included milk, yogurt, cheese, bread, pasta, soup, fresh produce and desserts. One order for sugar snap peas was fully refunded because the wrong brand was supplied, so we excluded both its cost and associated claimed savings from our totals.
We never assume a discounted item is automatically worth buying. We still check dates, plan how to use or freeze the food, and compare prices. For more tips, read our Flashfood guide.
Our grocery spending was 22.89% below the amount we budgeted for August. That was one of the brighter spots in a month when several other categories ran higher than expected.
2026 Grocery Spending Tracker: January to August
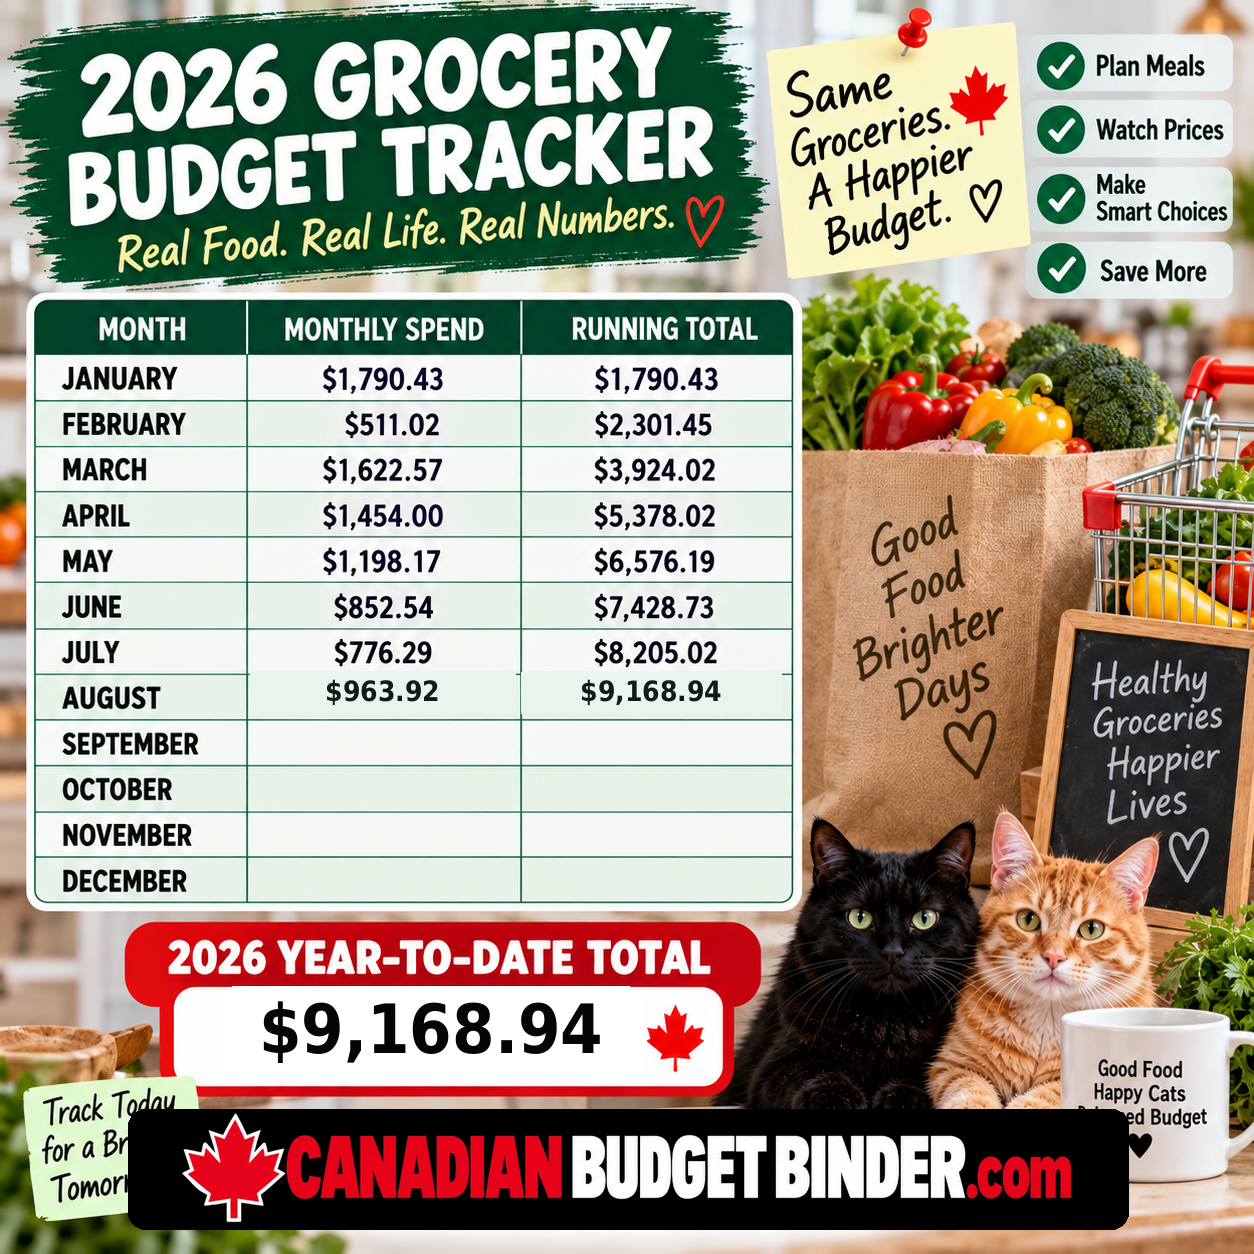
The full 2026 grocery history is shown below as percentages to protect our household’s private spending figures. Monthly budget used compares each month with its own grocery allowance; running budget used compares cumulative spending with the cumulative allowance through that month.
| Month | Monthly grocery budget used | Running grocery budget used |
|---|---|---|
| January | 143.23% | 143.23% |
| February | 40.88% | 92.06% |
| March | 129.81% | 104.64% |
| April | 116.32% | 107.56% |
| May | 95.85% | 105.22% |
| June | 68.20% | 99.05% |
| July | 62.10% | 93.77% |
| August | 77.11% | 91.69% |
| Grocery tracking period | Budget used | Compared with plan |
|---|---|---|
| July 2026 | 62.10% | 37.90% under |
| August 2026 | 77.11% | 22.89% under |
| January–August combined | 91.69% | 8.31% under |
August’s grocery spending was 24.17% higher than July’s, although both months remained under their respective grocery allowances.
We track groceries month by month, using the cumulative budget to put each result in context. Adding August to the January-to-July running total reported in our previous budget update puts our January-to-August grocery spending at approximately 8.31% below the cumulative eight-month grocery budget. We compare the year-to-date total with our cumulative grocery budget, not just one month’s result.
We continue to shop carefully, compare unit prices, check markdowns and plan meals around what we already have. Our grocery price book guide and unit pricing guide explain two of the habits behind our approach.
August Grocery Savings Jar
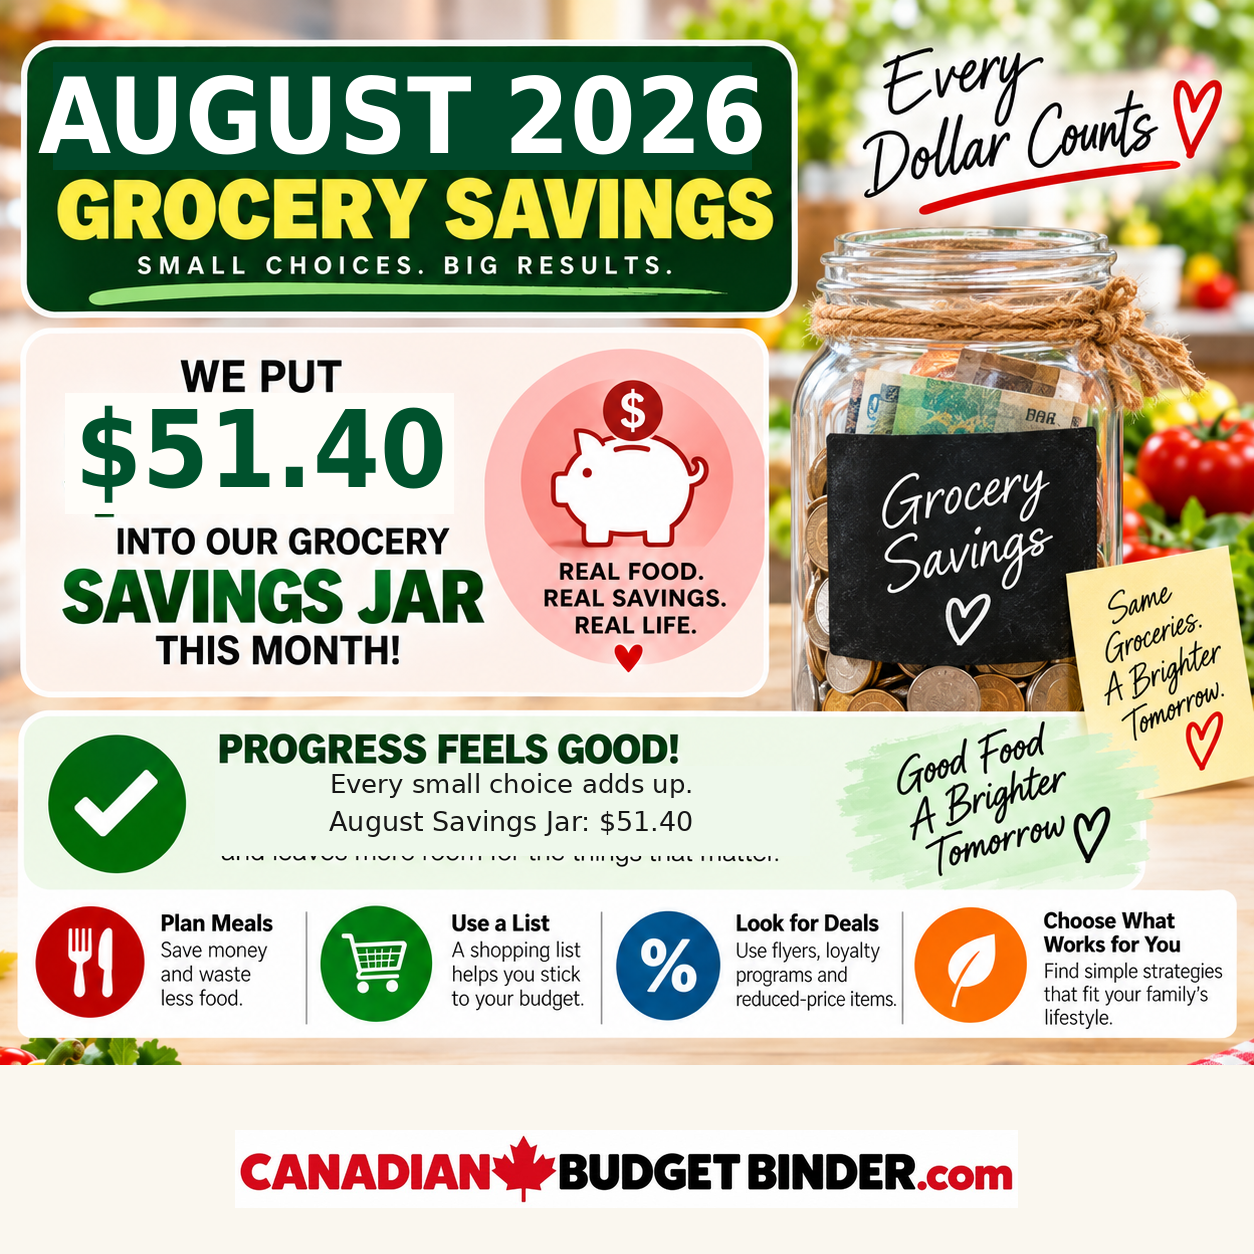
| Savings Jar measure | August update |
|---|---|
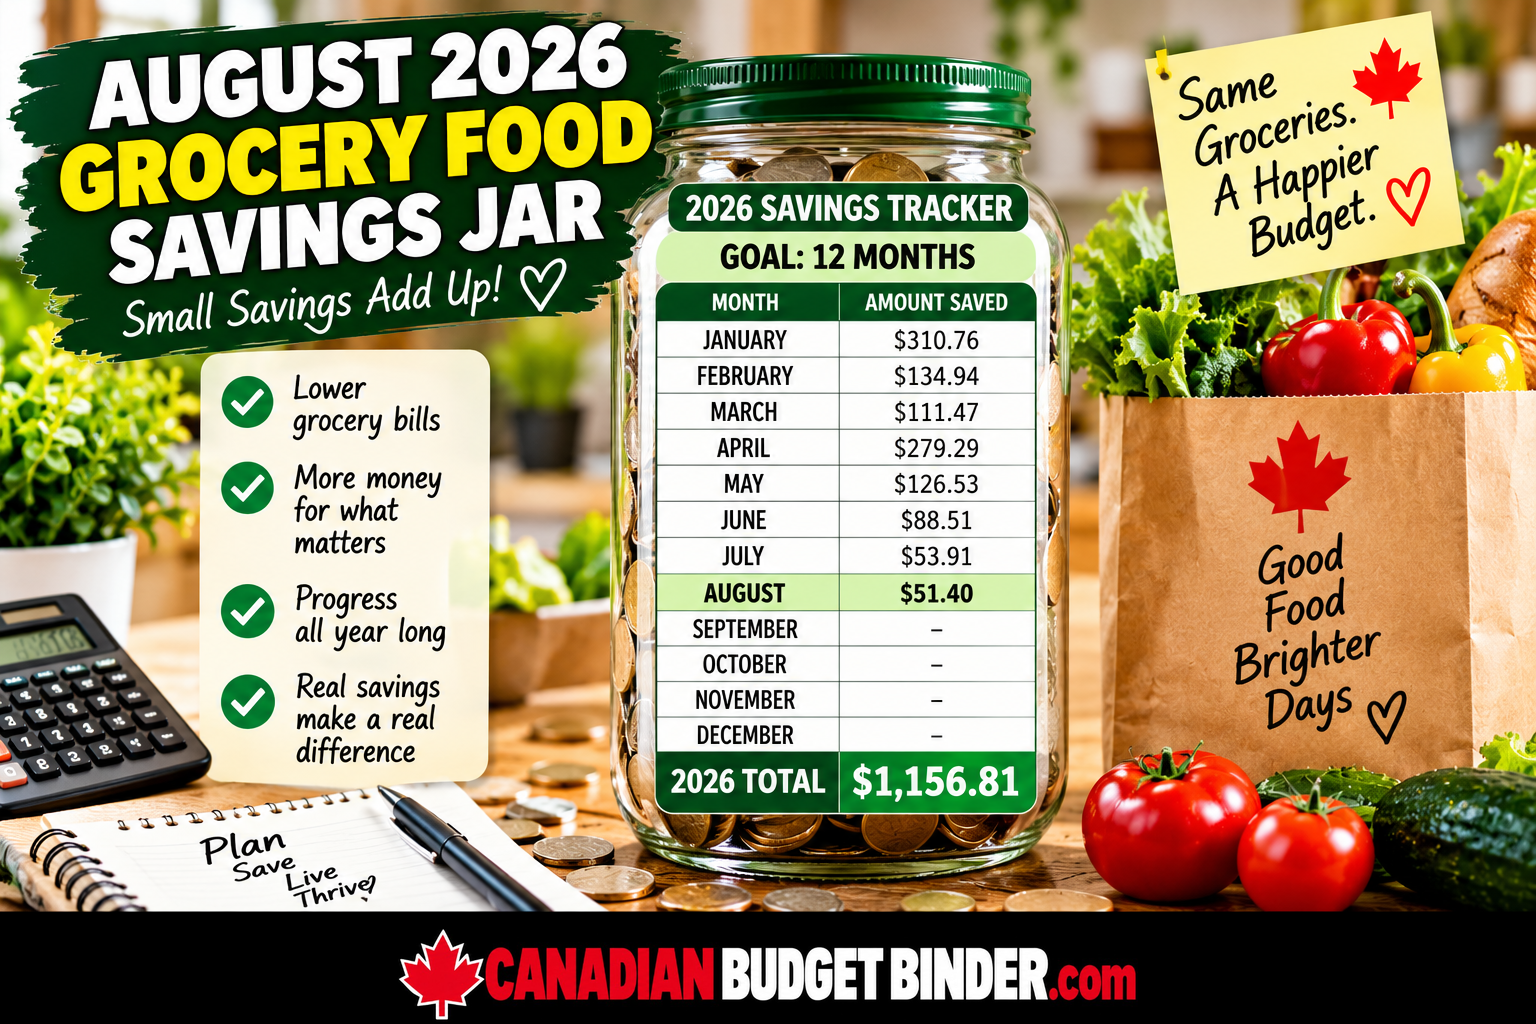
| Running total, January–August versus January–July | Up 4.65% |
| August’s new Savings Jar additions versus July’s | Down 4.66% |
Our Savings Jar counts qualifying markdowns and coupons, not Flashfood’s estimated app discounts. This keeps our savings records distinct and avoids counting the same promotion twice.
August’s Savings Jar additions raised the running total by approximately 4.65% compared with January–July.
These discounts represent savings against regular or listed prices, not cash deposited into a savings account.
2026 Grocery Savings Jar Running Tracker
August Household Rewards Snapshot
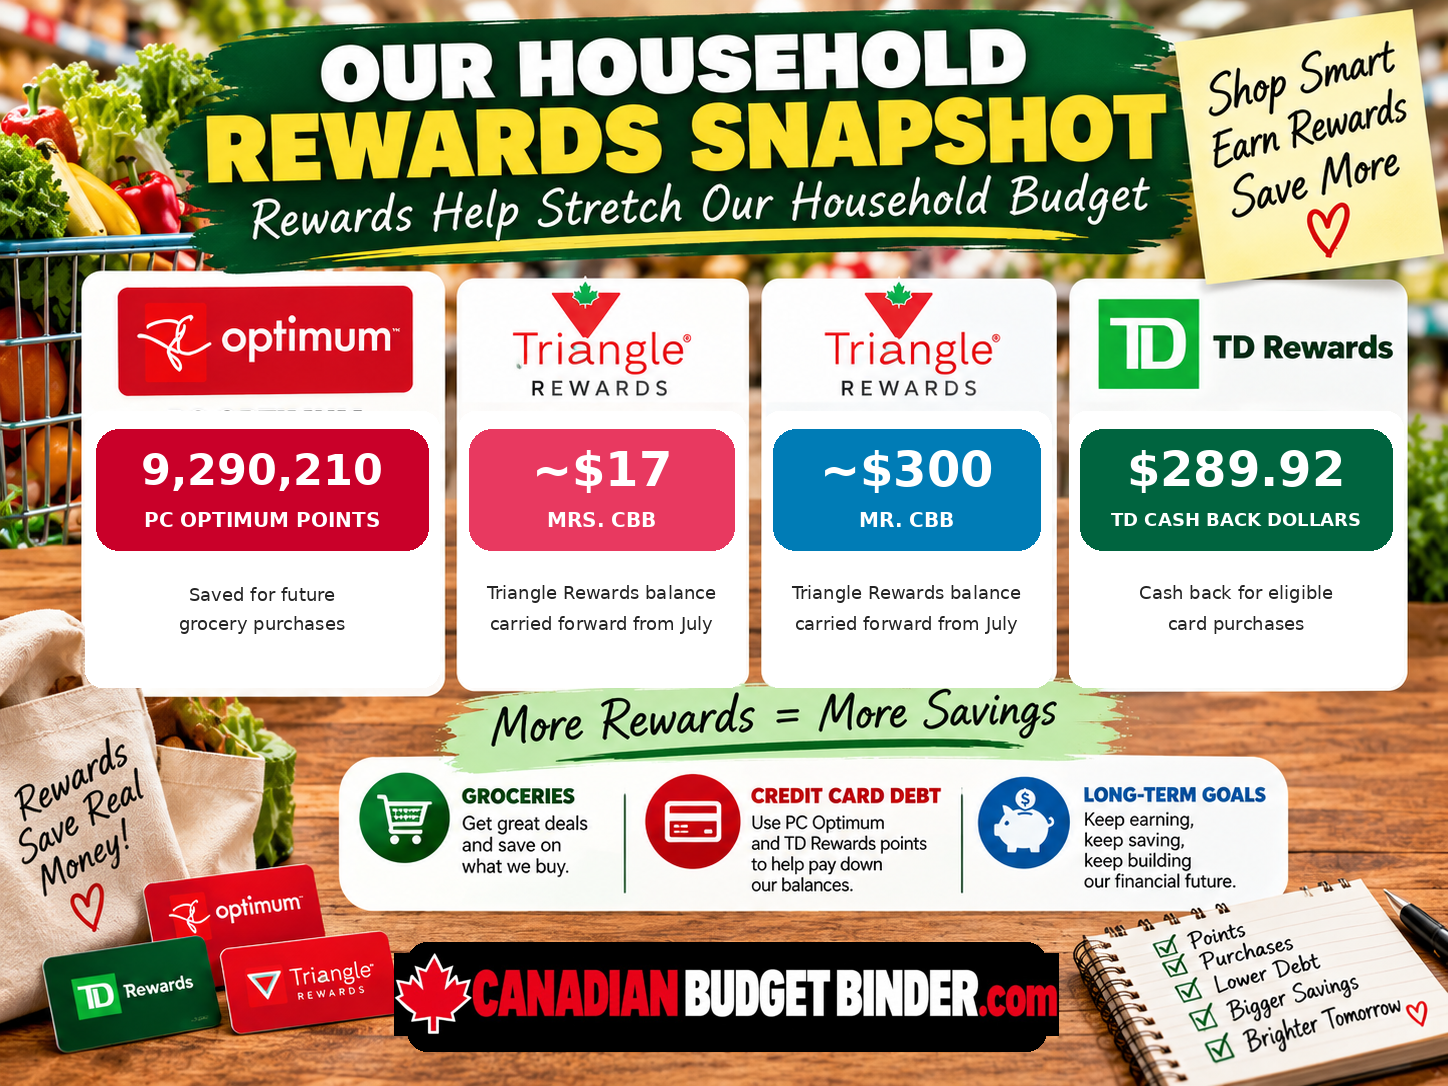
We also track grocery and household loyalty rewards separately from our Savings Jar. Rewards are not the same as money saved in our bank account, and we do not add them to the Savings Jar total.
Where We Went Over Budget
- Home maintenance: approximately 85.49% above its category plan.
- Pet expenses: approximately 48.86% above plan.
- Health and beauty: approximately 27.98% above plan.
- Birthdays: approximately 95.37% above plan.
- Memberships, clubs and sports: approximately 181.82% above plan.
- Car maintenance: approximately 58.79% above plan.
August’s spending was shaped by recovery after surgery, preparations for our son’s new school year and fall soccer, pet care and ongoing bathroom work. Many of the recovery purchases included supportive garments, comfortable clothing, a shower chair, a bedside table, an ice pack and a cervical pillow. We also stocked up on protein-rich snacks and other foods that were easier to manage during recovery. These weren’t all routine purchases, which is why we look beyond the percentages to understand each month.
Home maintenance included a replacement kettle after our old one failed, a bathroom ventilation fan and suction-cup tools for the bathroom renovation. Vehicle-related purchases included maintenance tools and car-care supplies. Our son’s backpack was a back-to-school purchase, while his fall indoor soccer registration affected the sports category. Some birthday gifts were purchased ahead of his September birthday.
We looked for Amazon Resale offers on many purchases, from pantry staples and pet food to laundry and dishwashing supplies. Not everything was resale: some products were purchased on sale or with coupons. We excluded cancelled purchases, returned goods and items reimbursed by family from our household totals. In a few cases, incorrect quantities resulted in refunds with permission to keep the products, so those items did not remain paid expenses.
August Household Budget Percentages
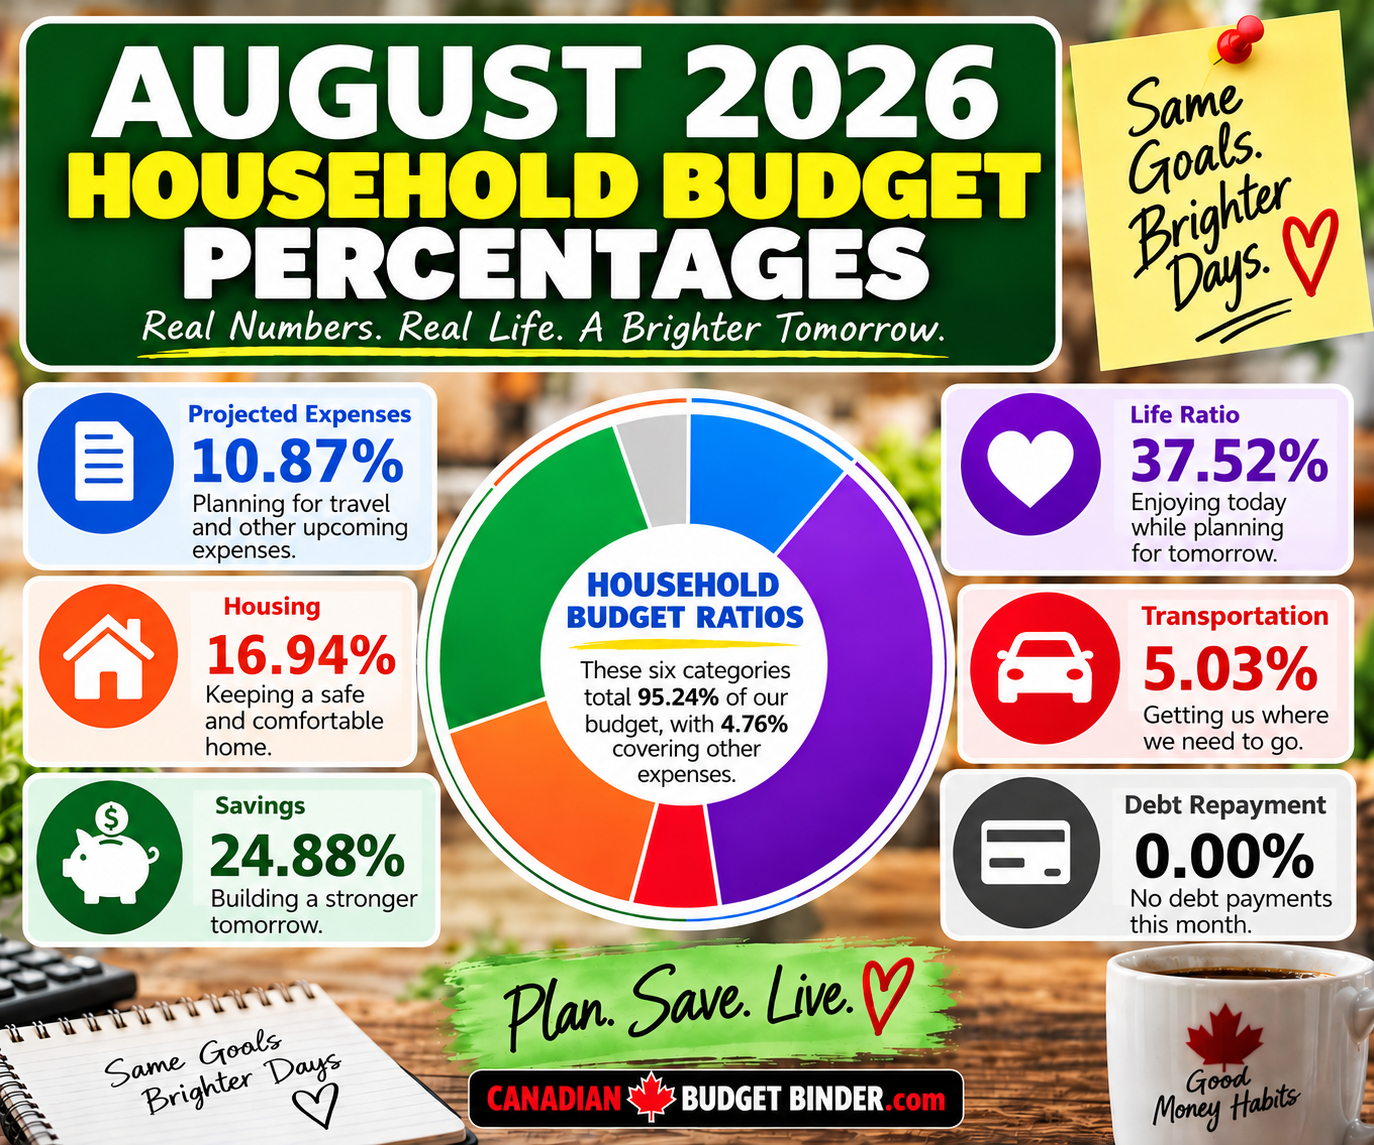
| Budget ratio | August 2026 |
|---|---|
| Projected expenses | 10.87% |
| Life ratio | 37.52% |
| Debt repayment | 0.00% |
| Transportation | 5.03% |
| Savings | 24.88% |
| Housing | 16.94% |
These are the ratios shown in our August tracking chart. The savings ratio remained above our 10% benchmark, while our life ratio exceeded the 25% guideline used in our household tracker. The chart’s ratios do not sum to exactly 100%, so we present them as separate measures rather than as shares of one pie.
Monthly Financial Progress
Our tracked net worth increased by 1.22% from July to August. Our cash and emergency savings asset category increased 9.25%, while our combined pension, RRSP and TFSA category increased 1.06%. These are month-to-month changes, not investment returns. We keep the underlying balances private.
Read more about building an emergency fund in Canada.
Free Budget Tool: Plan for Bills That Sneak Up on You
Car repairs, vet bills, school activities and annual renewals are not monthly bills, but they still need a place in the budget. Try this simple projected-expenses worksheet using your own numbers.
Your 5-Minute Projected Expenses Planner
- List three bills you expect in the next 12 months.
- Estimate the cost of each bill and how many months remain until it is due.
- For each bill, divide the amount you still need by the number of months left. That is your monthly savings target.
- Add the targets together, then adjust your spending plan if the total is more than you can afford.
| Upcoming expense | Amount still needed | Months left | Save each month |
|---|---|---|---|
| Car maintenance | Your estimate | 4 | Your target |
| Pet care | Your estimate | 6 | Your target |
| Holiday spending | Your estimate | 3 | Your target |
| Example total | Your total | — | Your total |
These are examples, not our family’s actual expenses. If a bill is due sooner than a month away, budget the remaining amount now rather than dividing by zero. Keep money for upcoming bills separate from emergency savings.
Try it: What is one expense you know is coming but have not yet put money aside for?
Need a starting point? Read our projected expenses guide and browse the CBB Free Tools collection for budgeting worksheets.
What We Learned and September Budget Goals
August reminded us that one good category cannot always cancel out several larger bills. Our grocery results were encouraging, but we also need to review irregular home, vehicle, pet and family expenses to make sure our projected-expense categories remain realistic.
As we move into September, our goals are to keep tracking every purchase, review the categories that exceeded their targets and continue making deliberate grocery choices. We will share our September results in the next household budget update.
Your turn: What’s one grocery item you’ve stopped buying because it’s become too expensive? Tell us in the comments—no prices or personal financial details needed.