

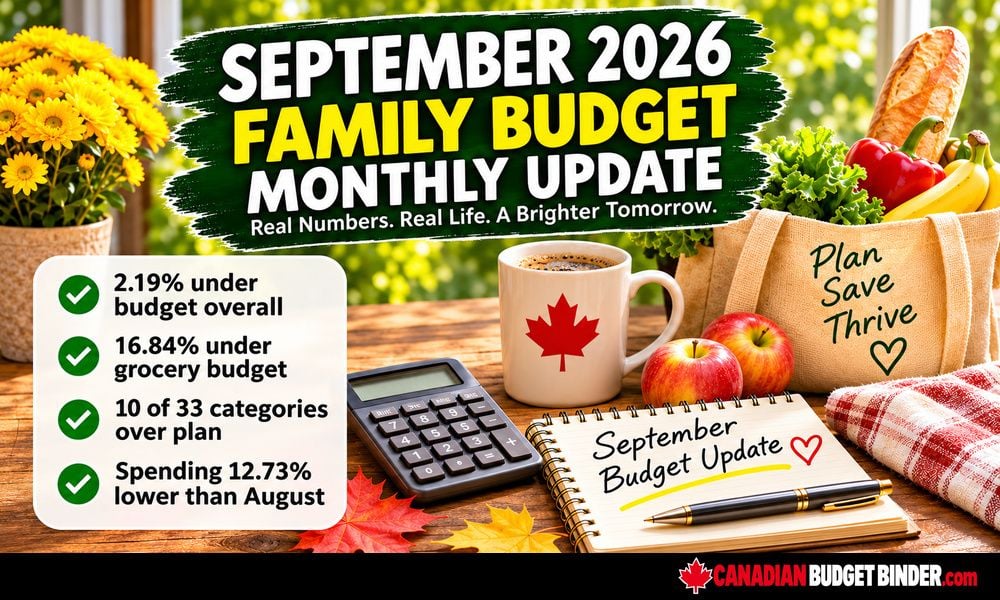

Our September 2026 household budget had a surprising result: we kept groceries 16.84% under budget, yet 10 of our 33 budget categories went over their individual plans. Even with those extra expenses, our overall budget finished 2.19% under. Total tracked budget outflows were also 12.73% lower than in August. Here’s what happened, what we saved and what we’ll take into next month’s budget.
Catch up with our August 2026 cost of living report before reading September’s results.
September 2026 Budget Snapshot
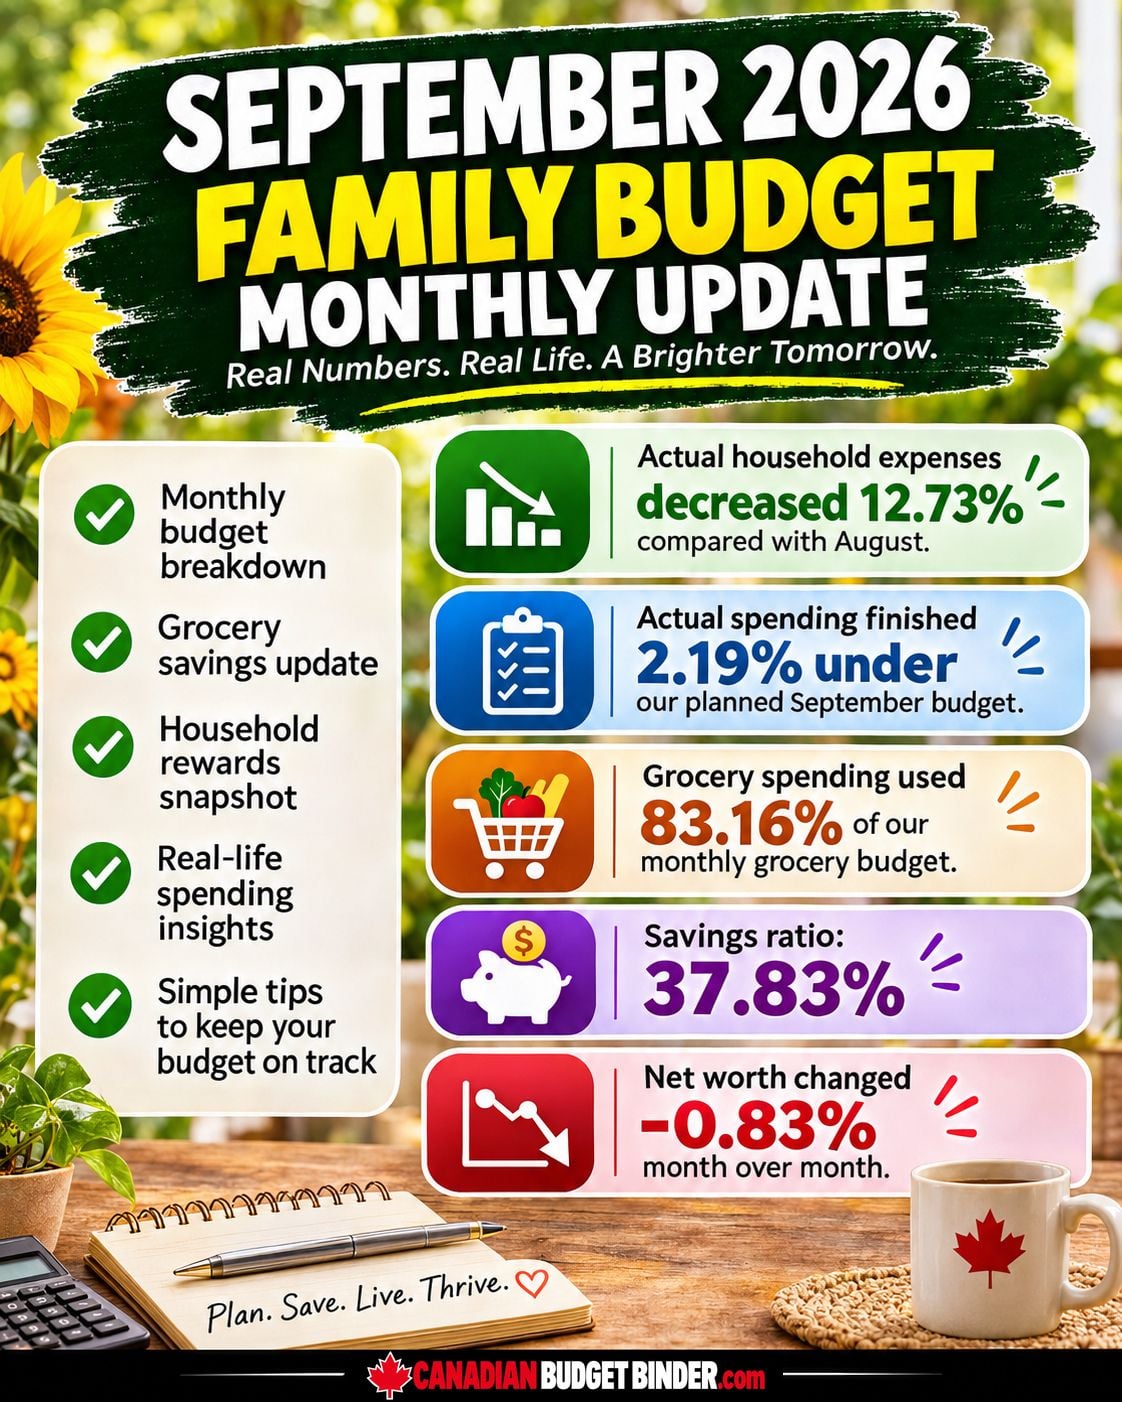
- Tracked household outflows fell 12.73% compared with August.
- Our planned budget was $8,664.00; actual outflows were $8,474.12.
- We finished $189.88 (2.19%) under budget.
- Our savings ratio was 37.83%.
- Our overall net worth decreased 0.83% month over month; we keep the underlying balances private.
- Our debt repayment ratio was 0.00%.
Our balanced budget guide explains how we compare our planned expenses with what actually happens. September brought back-to-school routines, our son’s birthday, family outings and garden harvests. It was another reminder that a budget needs to work around real life.
Budgeted vs. Actual Spending
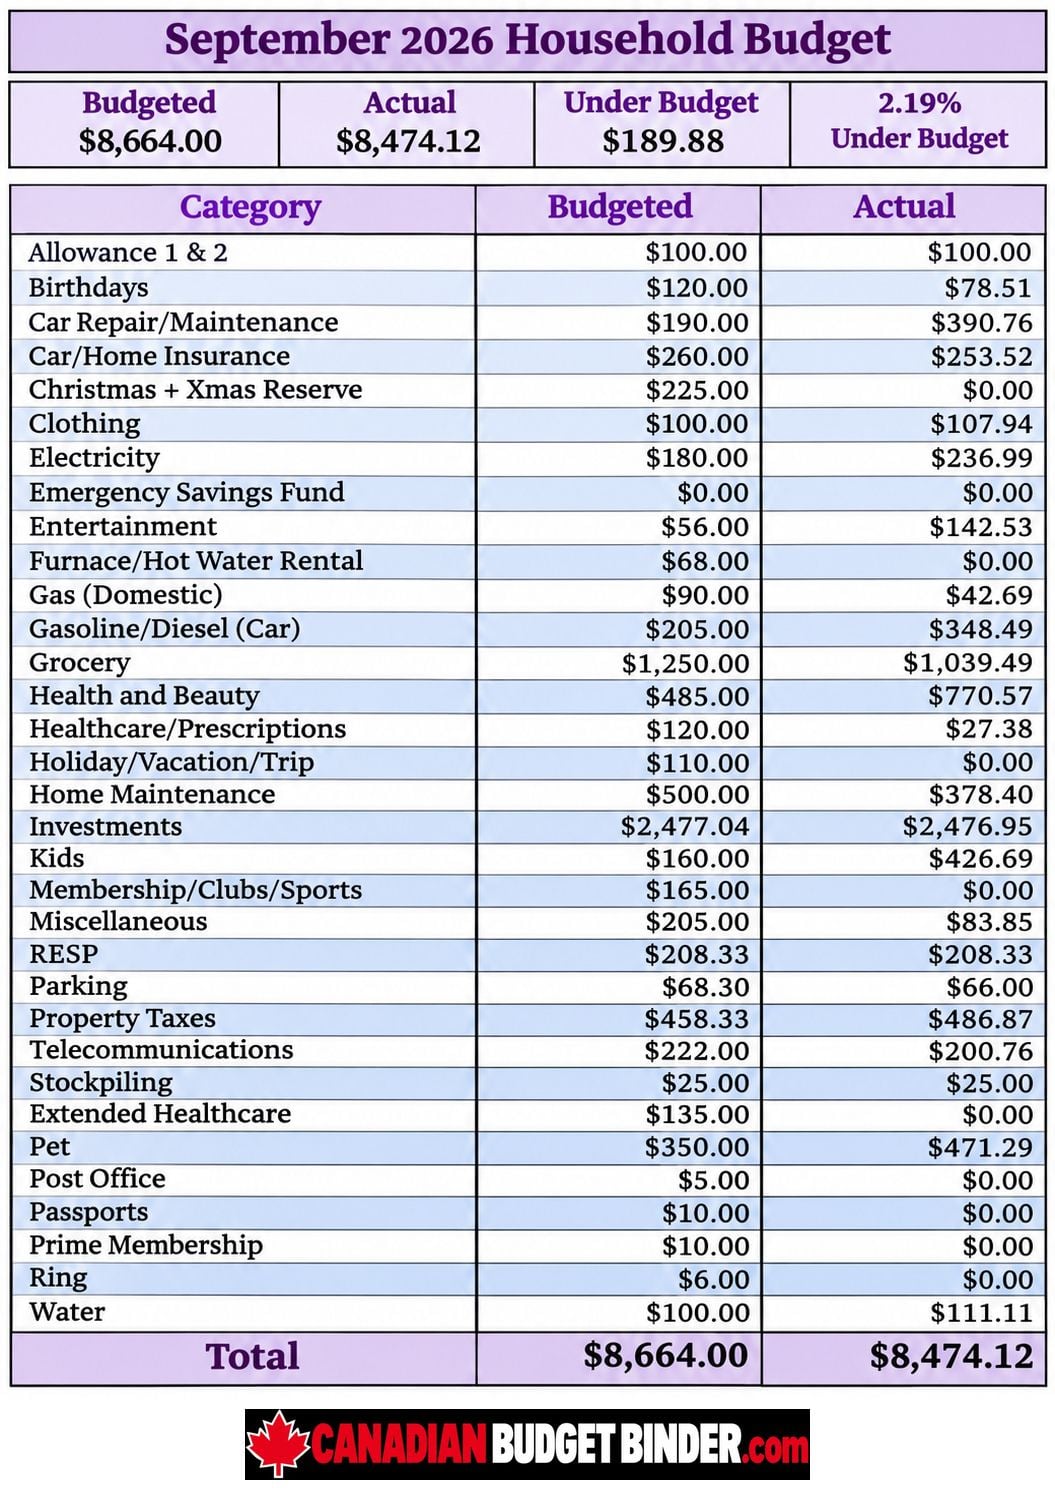
Here are all 33 of our September budget categories. The figures include monthly investment and RESP contributions as well as bills and household purchases. They are monthly outflows, not a statement of our accumulated assets, investment balances or income.
| Category | Budgeted | Actual |
|---|---|---|
| Allowance 1 & 2 | $100.00 | $100.00 |
| Birthdays | $120.00 | $78.51 |
| Car Repair/Maintenance | $190.00 | $390.76 |
| Car/Home Insurance | $260.00 | $253.52 |
| Christmas + Xmas Reserve | $225.00 | $0.00 |
| Clothing | $100.00 | $107.94 |
| Electricity | $180.00 | $236.99 |
| Emergency Savings Fund | $0.00 | $0.00 |
| Entertainment | $56.00 | $142.53 |
| Furnace/Hot Water Rental | $68.00 | $0.00 |
| Gas (Domestic) | $90.00 | $42.69 |
| Gasoline/Diesel (Car) | $205.00 | $348.49 |
| Grocery | $1,250.00 | $1,039.49 |
| Health and Beauty | $485.00 | $770.57 |
| Healthcare/Prescriptions | $120.00 | $27.38 |
| Holiday/Vacation/Trip | $110.00 | $0.00 |
| Home Maintenance | $500.00 | $378.40 |
| Investments | $2,477.04 | $2,476.95 |
| Kids | $160.00 | $426.69 |
| Membership/Clubs/Sports | $165.00 | $0.00 |
| Miscellaneous | $205.00 | $83.85 |
| RESP | $208.33 | $208.33 |
| Parking | $68.30 | $66.00 |
| Property Taxes | $458.33 | $486.87 |
| Telecommunications | $222.00 | $200.76 |
| Stockpiling | $25.00 | $25.00 |
| Extended Healthcare | $135.00 | $0.00 |
| Pet | $350.00 | $471.29 |
| Post Office | $5.00 | $0.00 |
| Passports | $10.00 | $0.00 |
| Prime | $10.00 | $0.00 |
| Ring | $6.00 | $0.00 |
| Water | $100.00 | $111.11 |
| Total | $8,664.00 | $8,474.12 |
We went over plan in 10 categories, stayed below plan in 19, matched the planned amounts in three, and had no planned or actual emergency savings contribution in that category. The combined result was still 2.19% below budget. Our grocery spending helped offset higher costs elsewhere.
| September budget comparison | Actual as % of plan | Result |
|---|---|---|
| Entire household budget | 97.81% | 2.19% under |
| Groceries | 83.16% | 16.84% under |
| Kids | 266.68% | 166.68% over |
| Entertainment | 254.52% | 154.52% over |
| Car repairs and maintenance | 205.66% | 105.66% over |
| Gasoline / diesel | 170.00% | 70.00% over |
| Health and beauty | 158.88% | 58.88% over |
| Pet expenses | 134.65% | 34.65% over |
Each percentage compares a category with its own plan, not with total household outflows. If you are setting up a budget, our guide to choosing budget categories and projected expenses guide can help you prepare for irregular bills.
September Grocery Budget and Savings
September Flashfood Results
We completed 11 Flashfood orders in September, covering 46 items. The total paid was $133.09, including $13.17 in fees and taxes. Of that total, $111.12 was for food and $21.97 was for shampoo, which belongs outside the grocery category. We don’t add those amounts to the household total a second time.
Some of our favourite finds were 36 eggs for $9, 36 oatmeal cookies for $2.25, four lactose-free cheeses for $8, seven packs of pork bangers for $21, and two whole chickens for $12. We also found our son’s chocolate birthday cake for $12 before fees, a pumpkin pie for $1.28 and a vanilla cake for $1. These are item prices before applicable checkout charges.
We still compare unit prices, check dates and plan how to use or freeze our purchases. A bargain only helps if it suits our household. Read our Flashfood guide to see how the app works. We aren’t reporting an estimated September retail-value saving because we don’t have verified original retail prices for all the purchases.
Our September grocery allowance was $1,250 and we spent $1,039.49, leaving $210.51 below the allowance. That’s 16.84% under budget. Grocery spending was 7.84% higher than in August, but both months finished below their plans. We also picked up reduced bananas for baking, enjoyed apples and pears from a family outing and continued harvesting cherry tomatoes from the garden.
2026 Grocery Spending Tracker: January to September
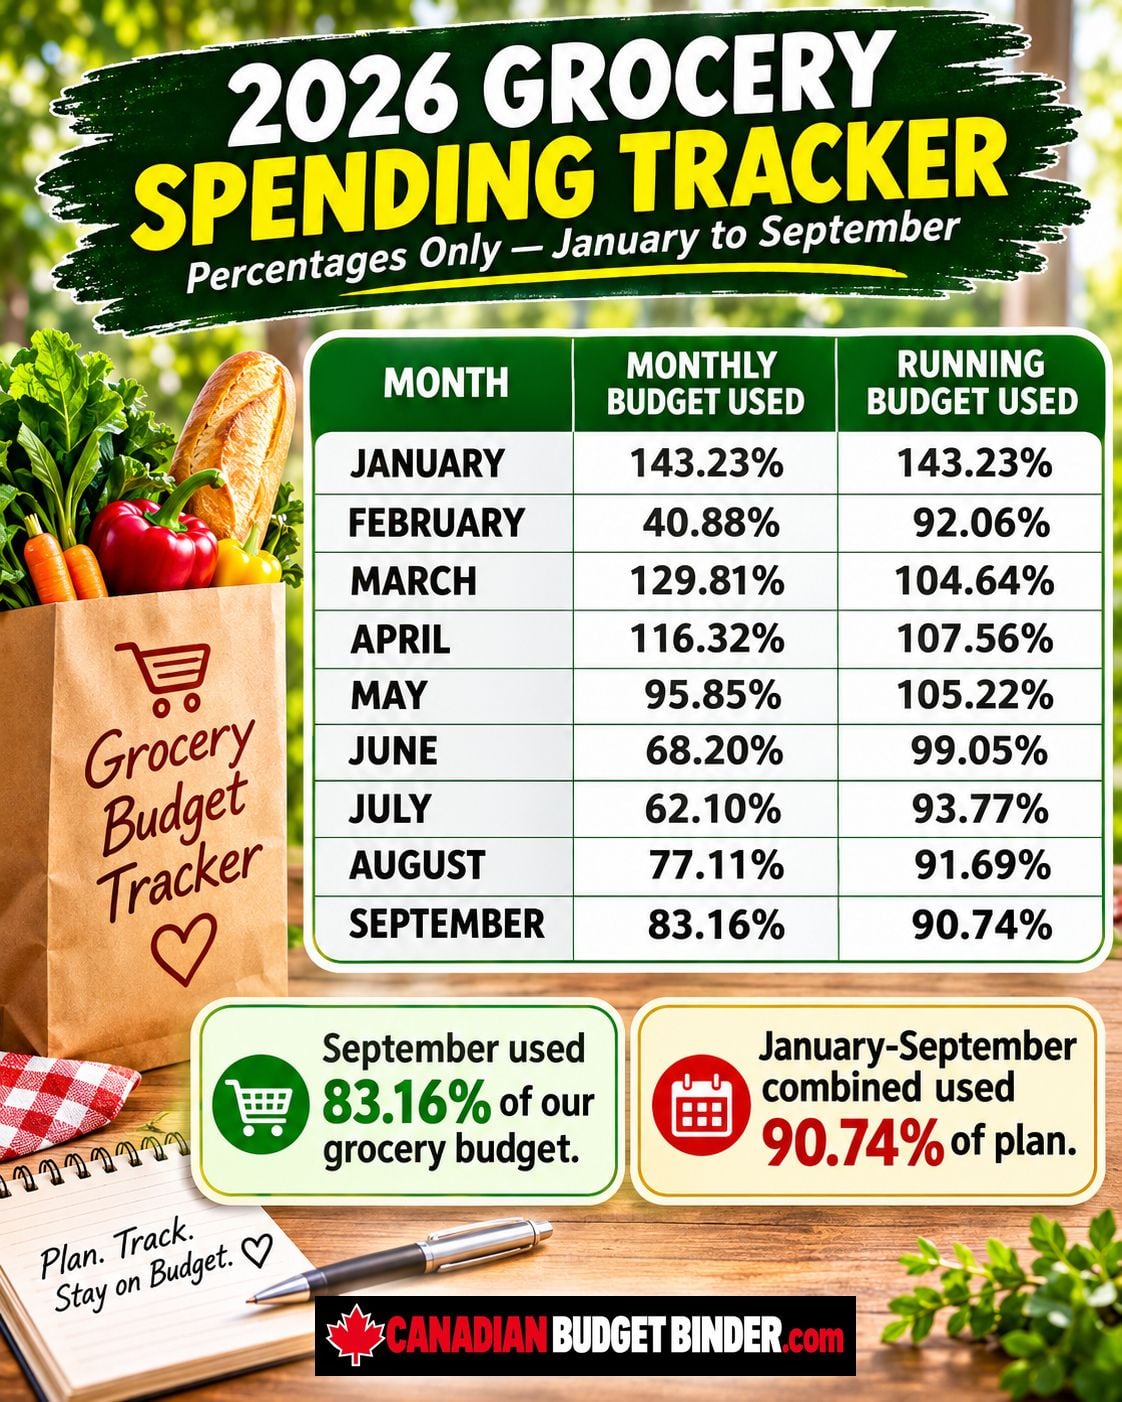
Monthly budget used compares each month’s spending with its grocery allowance. Running budget used compares cumulative grocery spending with the cumulative allowance through that month.
| Month | Monthly grocery budget used | Running grocery budget used |
|---|---|---|
| January | 143.23% | 143.23% |
| February | 40.88% | 92.06% |
| March | 129.81% | 104.64% |
| April | 116.32% | 107.56% |
| May | 95.85% | 105.22% |
| June | 68.20% | 99.05% |
| July | 62.10% | 93.77% |
| August | 77.11% | 91.69% |
| September | 83.16% | 90.74% |
From January through September, our grocery spending totalled $10,208.43 against a cumulative $11,250 allowance. We used 90.74% of the plan, leaving us 9.26% below budget for the year so far.
We continue to compare package sizes, check markdowns and plan meals around what we already have. Our grocery price book guide and unit pricing guide explain two of the habits behind our approach.
September Grocery Savings Jar
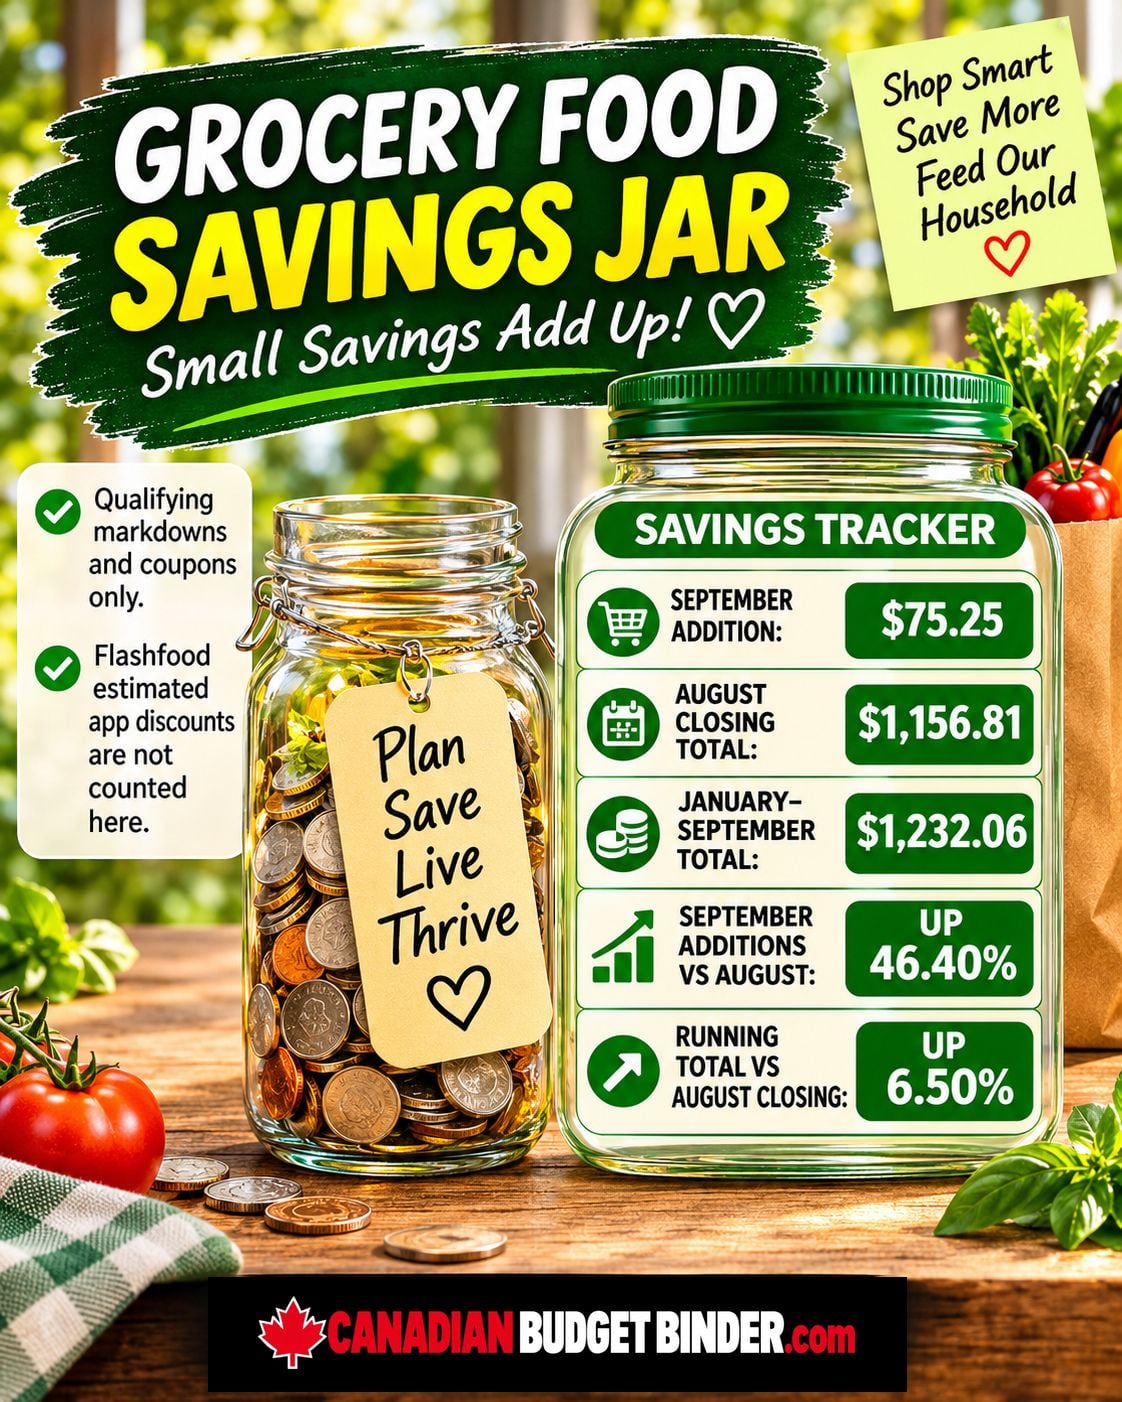
We added $75.25 in qualifying grocery savings to our September tracker, compared with $51.40 in August. That’s a 46.40% increase in monthly additions. The running total grew 6.50%, from $1,156.81 to $1,232.06.
Our Savings Jar counts qualifying coupons and markdowns, not Flashfood’s estimated in-app discounts. We keep these records separate to avoid counting the same promotion twice. Savings against listed prices are not necessarily cash deposited into a bank account.
2026 Grocery Savings Jar Running Tracker
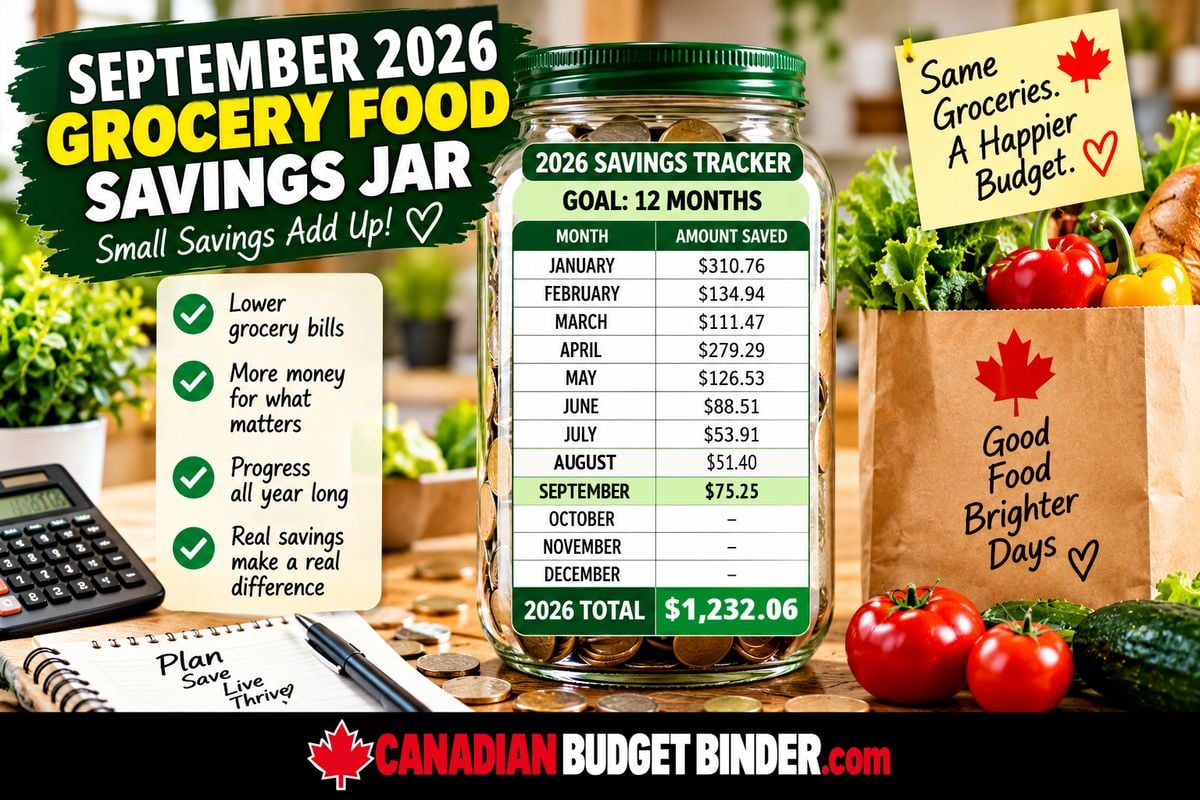
| Month | Amount saved |
|---|---|
| January | $310.76 |
| February | $134.94 |
| March | $111.47 |
| April | $279.29 |
| May | $126.53 |
| June | $88.51 |
| July | $53.91 |
| August | $51.40 |
| September | $75.25 |
| October | — |
| November | — |
| December | — |
| 2026 total through September | $1,232.06 |
Small savings add up. By tracking them throughout the year, we can see the value of the everyday discounts we might otherwise overlook.
September Household Rewards Snapshot
We track grocery and household loyalty rewards separately from the Savings Jar. These are loyalty points and cash-back balances, not investment or bank balances.
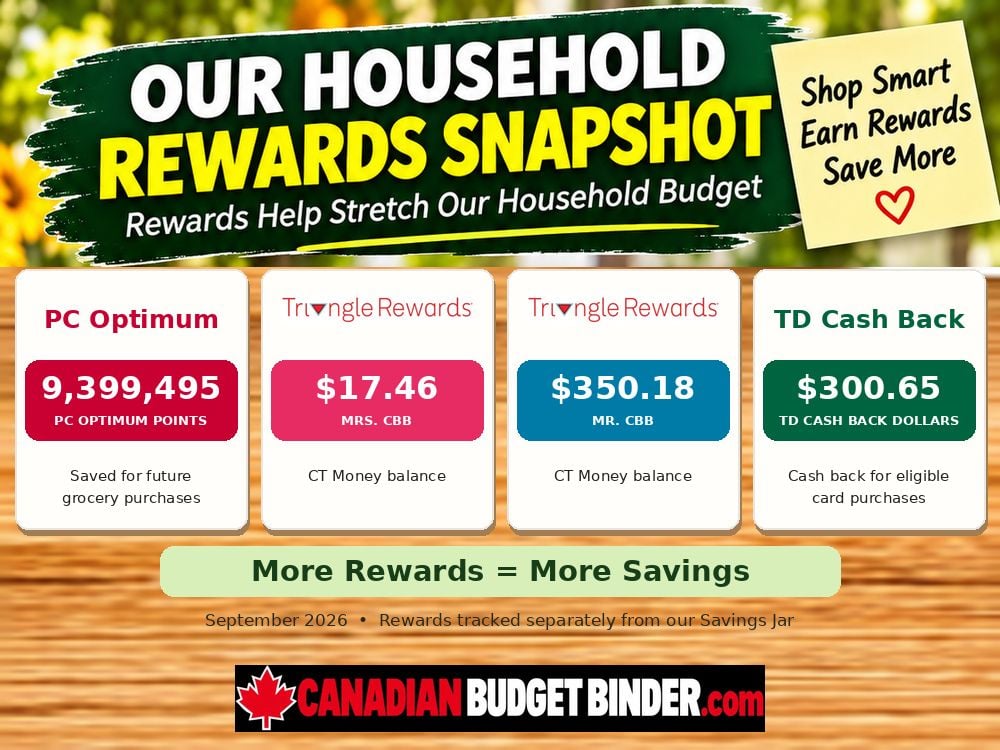
| Rewards program | September balance |
|---|---|
| PC Optimum | 9,399,495 points |
| Mrs. CBB — Triangle Rewards | $17.46 |
| Mr. CBB — Triangle Rewards | $350.18 |
| TD Cash Back | $300.65 |
Our PC Optimum balance grew from 9,290,210 points in August. Canadian Tire and Sport Chek use the same Triangle Rewards program; Mrs. CBB and I have separate accounts, so the two balances are recorded separately. Our TD cash back was $300.65, up from $289.92 in August.
Where We Went Over Budget
Ten categories went over their individual budgets. The six largest percentage overruns were:
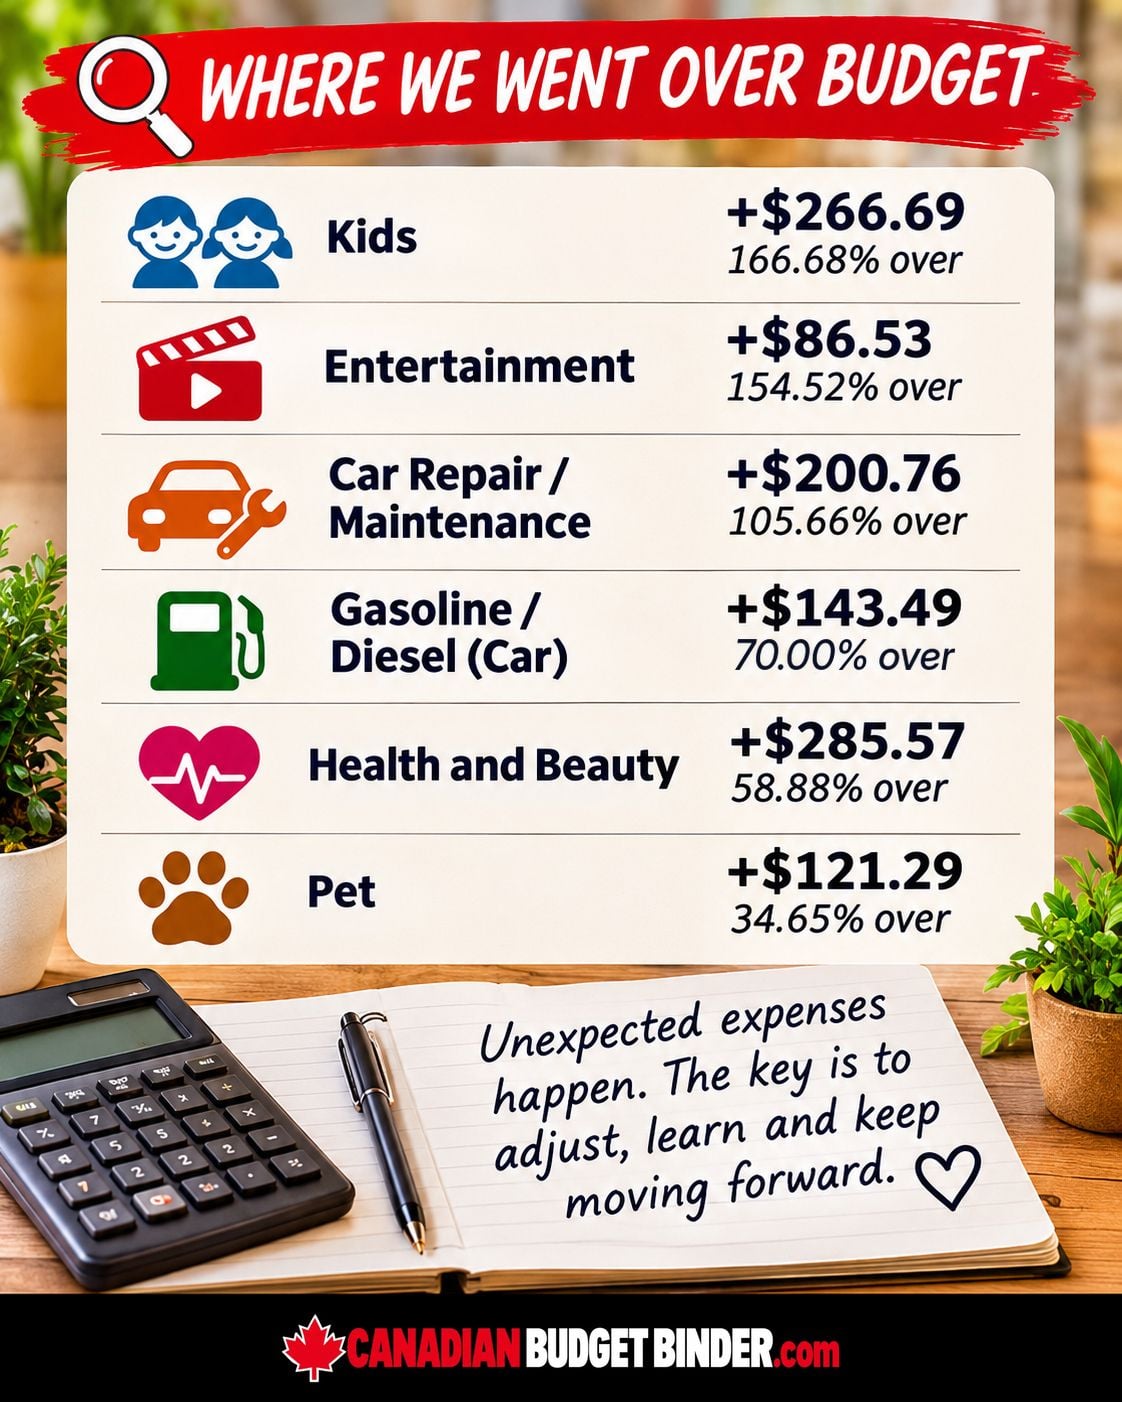
- Kids: 166.68% over ($266.69 above plan).
- Entertainment: 154.52% over ($86.53 above plan).
- Car repairs and maintenance: 105.66% over ($200.76 above plan).
- Gasoline and diesel: 70.00% over ($143.49 above plan).
- Health and beauty: 58.88% over ($285.57 above plan).
- Pet expenses: 34.65% over ($121.29 above plan).
Electricity, water, clothing and property taxes also exceeded their allowances. It’s worth looking at the reason behind each change rather than assuming every extra expense will repeat.
Family Life and Back to School
Our son turned 12 in September and was settling into Grade 7. We celebrated with the chocolate fudge cake I found on Flashfood. His birthday gifts included a backlit gaming keyboard with a volume control and a mouse. The birthday category itself came in below plan, even though the overall kids category was higher.
We don’t eat out very often, but our little family treats add up: pizza, a muffin after speech therapy and a stop at McDonald’s after Saturday soccer. It’s a reminder to include the everyday things we actually enjoy when we budget for entertainment.
Transportation, Home and Pet Expenses
Our driving routine has changed. A commute that used to take about 10 minutes each way now takes at least 40 minutes a day altogether, with more traffic. That helps explain why fuel was one of our larger overruns. Car maintenance also ran over plan this month.
At home, I repaired a closet door and picked up an abrasive blast cabinet for cleaning brake parts and other items. Home maintenance came in below its allowance. We also had a veterinary visit with our cat, including an examination, medication and a rabies vaccination. Pet care is one of those expenses that can change quickly from month to month.
September also meant apple picking, enjoying the garden’s late harvest and baking banana bread. Those little things are a welcome reminder that a family budget isn’t just about the bills.
September Household Budget Percentages
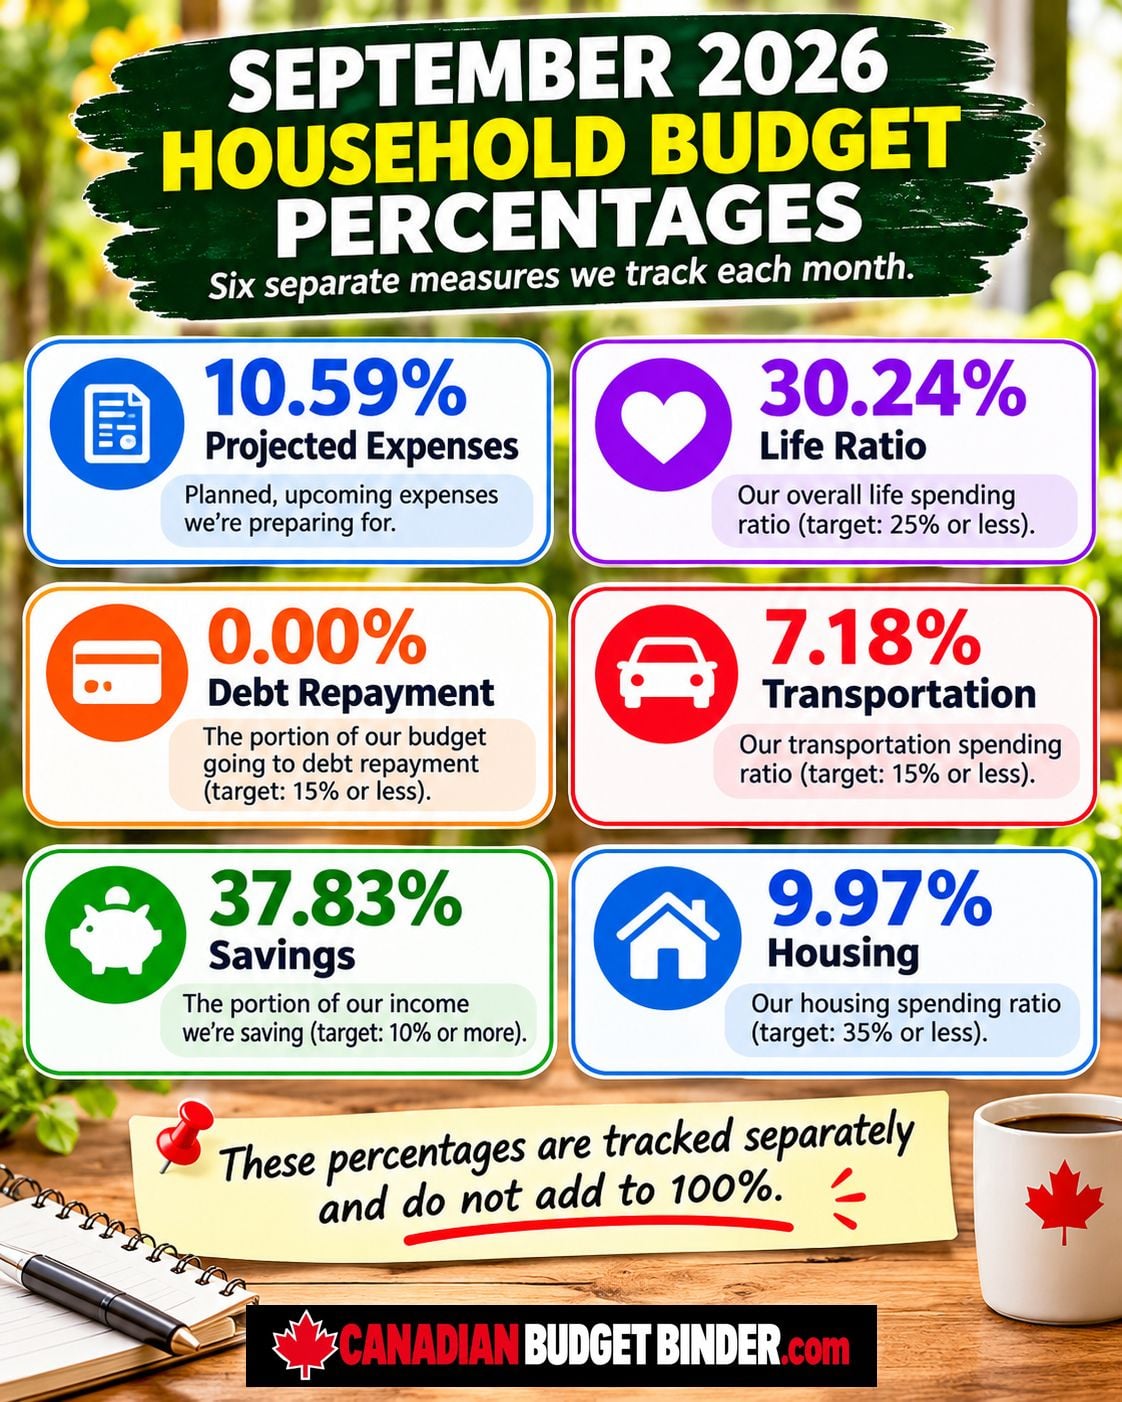
| Budget ratio | September 2026 |
|---|---|
| Projected expenses | 10.59% |
| Life ratio | 30.24% |
| Debt repayment | 0.00% |
| Transportation | 7.18% |
| Savings | 37.83% |
| Housing | 9.97% |
These are separate measures, not six slices of a single pie. Our savings ratio rose 12.95 percentage points from August’s 24.88%, while the life ratio fell from 37.52% to 30.24%. The savings ratio is above our 10% benchmark, and the life ratio remains above our 25% guideline. These are the guidelines we use in our own household tracker, not universal rules.
Monthly Financial Progress
Our tracked net worth decreased 0.83% from August to September. We share the percentage change rather than the underlying cash, pension, RRSP, TFSA, investment or other asset balances. Our home and vehicle remain paid off, and our debt repayment ratio was zero. Debt-free living doesn’t remove the need to budget for property taxes, insurance, maintenance and other bills.
Read more about building an emergency fund in Canada.
Free Budget Tool: Plan for Bills That Sneak Up on You
Car repairs, vet bills, school activities and annual renewals don’t always arrive every month, but they need a place in a realistic budget.
Your 5-Minute Projected Expenses Planner
- List three bills you expect in the next 12 months.
- Estimate the cost of each bill and how many months remain until it is due.
- Divide the amount you still need by the number of months left to work out your monthly savings target.
- Add the targets together and adjust your plan if the total is more than you can afford.
| Upcoming expense | Amount still needed | Months left | Save each month |
|---|---|---|---|
| Car maintenance | Your estimate | 4 | Your target |
| Pet care | Your estimate | 6 | Your target |
| Holiday spending | Your estimate | 3 | Your target |
| Example total | Your total | — | Your total |
These are examples, not our actual expenses. If a bill is due sooner than a month away, budget the remaining amount now. Keep money for upcoming bills separate from emergency savings. Try our projected expenses guide or browse the CBB Free Tools collection for printable worksheets.
What We Learned and October Budget Goals
September showed why we track both the overall household budget and each separate category. We stayed under our grocery allowance and our total plan, despite ten categories exceeding their budgets. The useful question is whether those higher expenses were one-time costs or whether the plan needs to change.
We’ll continue to check upcoming bills, review our transportation budget and make deliberate grocery purchases. And as autumn settles in, we’re looking toward garden clean-up and planting garlic when conditions are right.
Need help getting started? Download our free budgeting tools and use your own numbers to build a plan that fits your household.
Your turn: What expense caught you by surprise in September, and how did you handle it? Share your experience in the comments — no private financial details needed.
Thanks for reading,
Mr. CBB